Jun 24, 2024
Developers, It's Time to Rethink Your Programming Stack. Go Language Agnostic!
In programming, the concept of a one-size-fits-all language is a fallacy. Different languages offer …

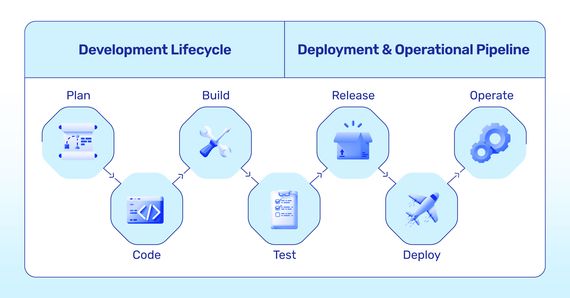
Modern software development often leverages distributed architectures to achieve faster development cycles and increased team autonomy. However, this approach comes with inherent challenges.ecomposing applications into smaller, independent services makes the system more complex. The distributed nature makes it increasingly difficult to trace the flow of requests across the entire system, especially as it scales.
This lack of visibility becomes particularly problematic during critical moments like deployments or outages, where rapid and accurate troubleshooting is essential. Therefore, effective methods for observing and understanding the overall system behaviour become extremely important.
OpenTelemetry, often abbreviated as OTel, is an open-source framework for monitoring software applications and infrastructure. It simplifies the collection and export of telemetry data, which provides insights into system performance and health.
OTel emerged in 2019 through the merging of two earlier projects, OpenTracing and OpenCensus. While both projects provided useful features, limitations existed that hindered broader adoption. Under the guidance of the Cloud Native Computing Foundation (CNCF), OpenTelemetry combines the strengths of its predecessors into a single, standardized framework. This unified approach eliminates the limitations of the past and allows for the collection of various types of monitoring data, resulting in a more complete picture of your the system’s overall health.
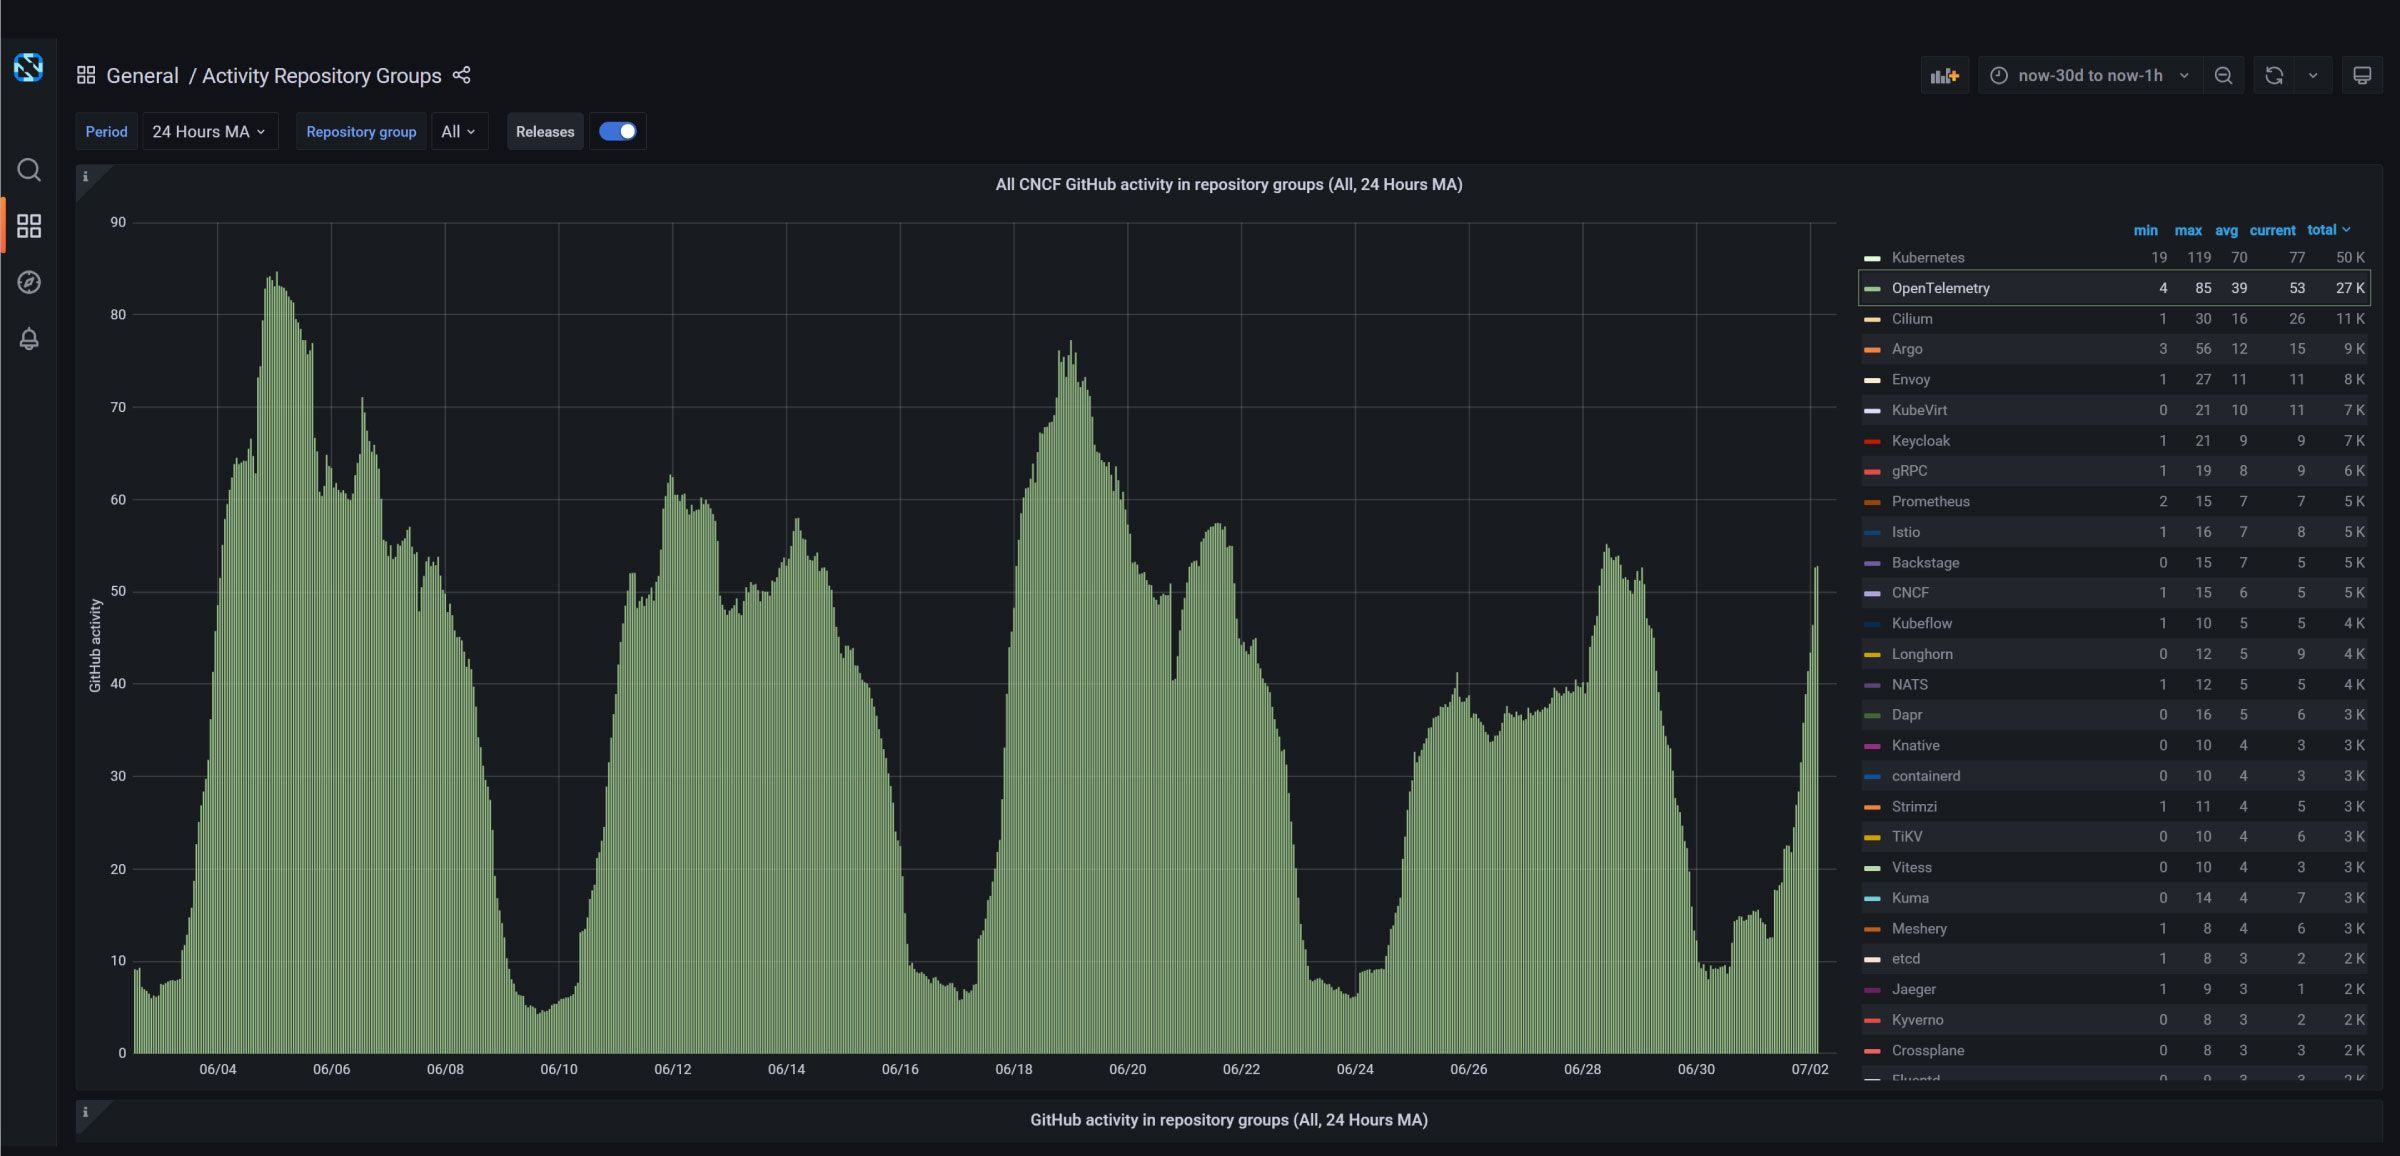
OpenTelemetry is currently the second most active CNCF project after Kubernetes.
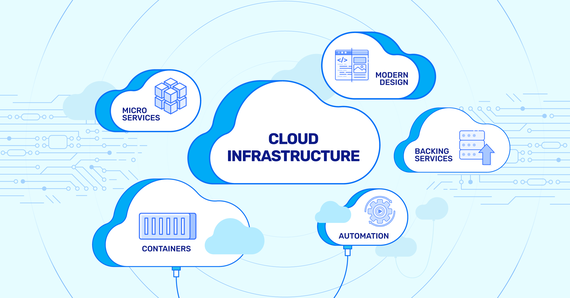
The growth of cloud computing, microservices architectures, and ever-more complex business needs has significantly increased the demand for effective software and infrastructure observability. OpenTelemetry addresses this growing need while adhering to two key principles:
Data Ownership: You retain control over the data generated by your applications and infrastructure. This eliminates vendor lock-in concerns.
Simplified Instrumentation: A single set of APIs and conventions govern data collection. This reduces the learning curve and simplifies the process of instrumenting applications.
Additionally, OpenTelemetry offers valuable functionalities for DevOps teams to tackle application problems.
Prioritized Request Handling: OpenTelemetry can establish a tiered system for requests within the system. This ensures that critical requests are prioritized appropriately when competing for resources.
Resource Usage Tracking: By capturing data on requests flowing between microservices, OpenTelemetry allows IT professionals to attribute resource usage by groups. This facilitates efficient monitoring of shared resources across the system.
Enhanced Microservices Observability: OpenTelemetry enables the collection of telemetry data from distributed applications, providing insights into their overall health. This valuable information empowers your team to optimize and ensure the smooth operation of the application.
Telemetry data refers to information collected about an application’s system’s performance and health. Having access to this data is crucial for IT professionals for effective performance management.
OpenTelemetry establishes a standardized approach for collecting and transmitting telemetry data, specifically within cloud-native applications. This standardized data can then be analyzed and monitored by the organization to identify areas for improvement and platform optimization.
Metrics: OpenTelemetry allows developers to instrument their code to capture various metrics, such as CPU utilization, memory usage, response times, and error rates. These metrics provide quantitative measurements of different aspects of the application’s behavior and performance.
Logs: With OpenTelemetry, developers can capture logs of important events, actions, or errors occurring within their applications. These logs can be structured or unstructured textual data, providing a historical record of activities that can be useful for troubleshooting, auditing, and analysis.
Traces: OpenTelemetry enables the generation and propagation of trace data, which represents the path followed by a specific request or transaction as it flows through a distributed system. Traces provide insights into the latency, dependencies, and performance characteristics of different components involved in processing the request.
OpenTelemetry simplifies the process of collecting and exporting telemetry data from applications and infrastructure. This framework uses standardized tools and instructions (APIs, SDKs) that are vendor-agnostic, efficiently managing data ingestion, transformation, and transportation.
APIs: These are programming language-specific instructions that allow the applications to generate telemetry data (data about performance and health). They are designed to be lightweight and minimize impact on application’s performance.
SDK (Software Development Kit): SDK implements the APIs and provides functionalities for collecting, processing, and exporting telemetry data from services. It includes features like data batching and configuration options to manage data collection and export efficiently.
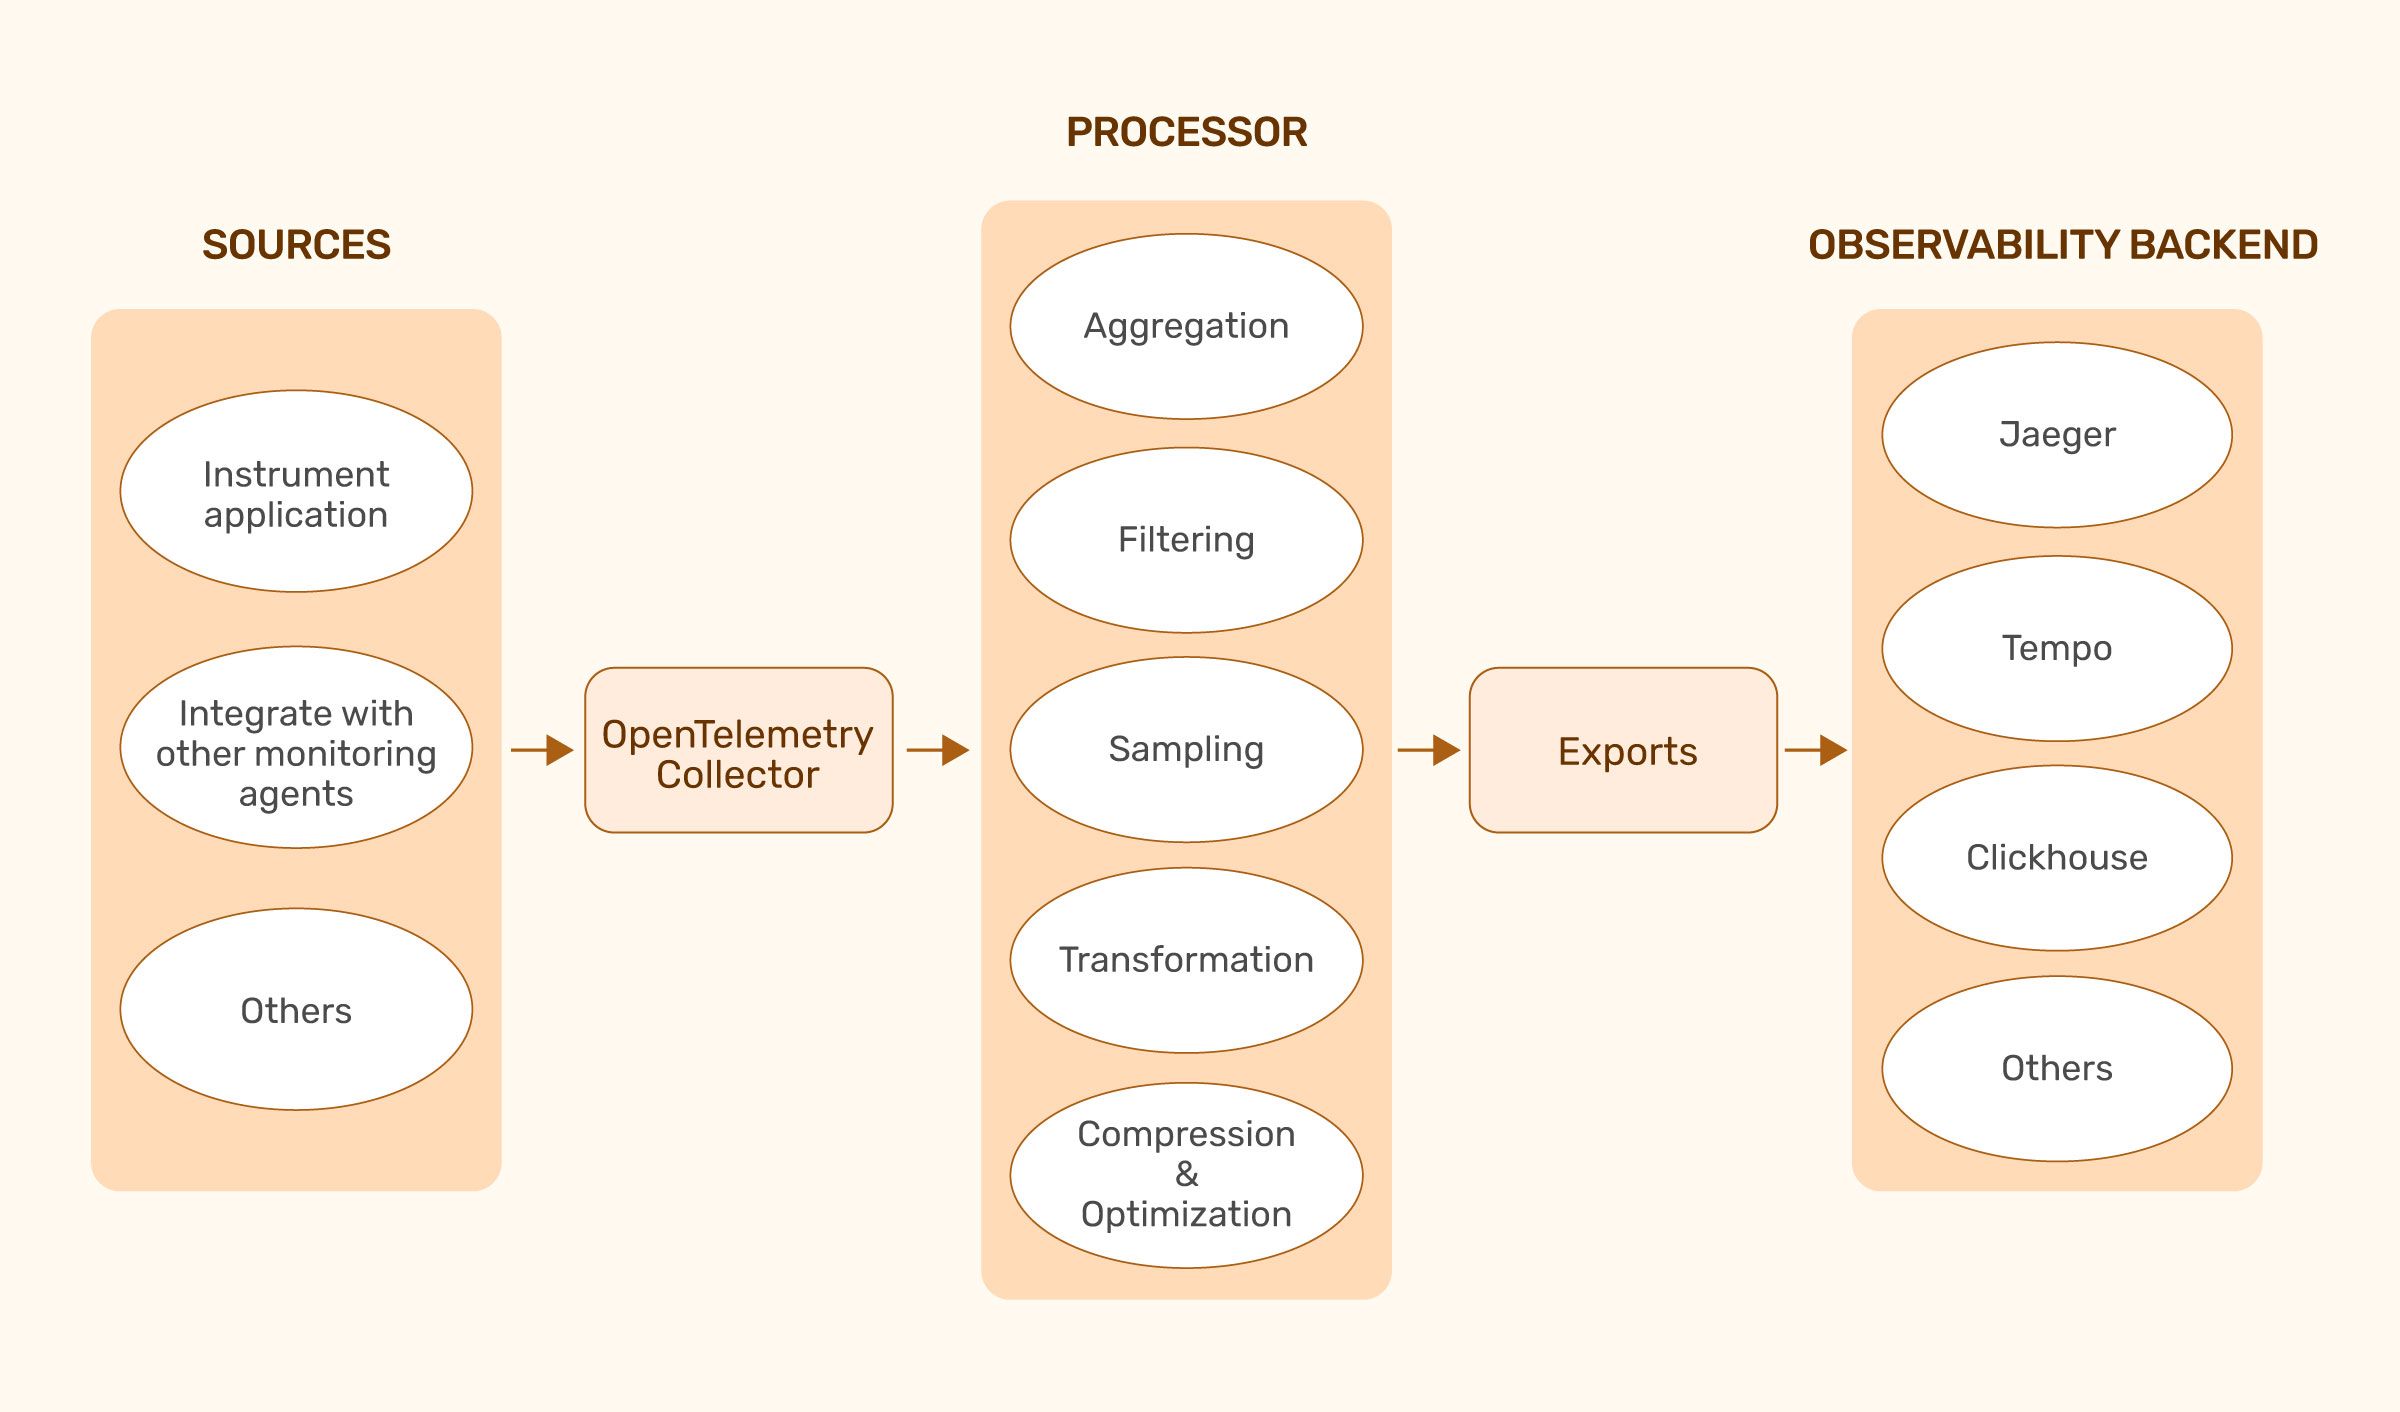
Collector: This service acts as a central hub for receiving, processing, and exporting telemetry data. It simplifies integration with existing infrastructure by providing a unified way to handle data ingestion and export. The Collector can be deployed independently or alongside applications for scalability and reliable data handling.
Receiver: This component acts as the entry point for telemetry data, receiving information from services. Receivers can handle different data types like traces, metrics, and logs; they process the data for further steps before sending it on.
Processor: Processors take the received data and perform actions like grouping, filtering, or adding additional information before sending it for export. They play a crucial role in customizing the data for one’s needs and improving system efficiency by reducing the amount of data exported.
Exporter: This component takes the final processed data and sends it to chosen destination for storage and analysis. This destination could be a database, a monitoring service, or any system that supports telemetry data analysis. Exporters offer flexibility for integrating OpenTelemetry with various backends and analysis tools.
Compage helps developers generate code with built-in instrumentation for OpenTelemetry. This means code created automatically tracks metrics (observability data) and sends them to OTel collector agents. Benefits of Compage with OTel:
Reduced Development Time: Eliminates the need to manually write code for instrumenting applications with OTel, saving significant time and effort.
Focus on Core Functionality: By handling OTel instrumentation, Compage allows developers to concentrate on building the core features and functionalities of their application.
Simplified Observability: Streamlines the process of collecting observability data, enabling easy monitoring of application performance and behavior without worrying about OTel implementation intricacies.
Want to streamline your application’s observability? Try Compage today

Shreya Trivedi is a Frontend Developer and Technical Content Writer.
In programming, the concept of a one-size-fits-all language is a fallacy. Different languages offer …
Hackers pose a persistent threat to businesses, devising new ways to steal data and disrupt operations. They …
Digital transformation has reshaped how businesses operate, keeping customers at the forefront. Its urgency …
Finding the right talent is pain. More so, keeping up with concepts, culture, technology and tools. We all have been there. Our AI-based automated solutions helps eliminate these issues, making your teams lives easy.
Contact Us