ebpf library

Last Update : 07 August, 2023 | Published : 17 April, 2023 | 3 Min Read

loading..

Cilium is an open-source project that provides a networking and security solution for containerized applications that leverages eBPF technology. The Cilium eBPF library provides a Go interface to the eBPF subsystem, making it easier to write eBPF programs in Go.

The Cilium eBPF library is a Go library that provides abstractions over eBPF programs and maps, as well as helpers for loading and attaching eBPF programs to various hooks in the Linux kernel.

Refer Cilium ebpf repository

Refer ebpf Official Documentation

Architecture of library

graph RL Program --> ProgramSpec --> ELF btf.Spec --> ELF Map --> MapSpec --> ELF Links --> Map & Program ProgramSpec -.-> btf.Spec MapSpec -.-> btf.Spec subgraph Collection Program & Map end subgraph CollectionSpec ProgramSpec & MapSpec & btf.Spec end

Refer for architecture

Cilium ebpf project structure

$tree xdp
xdp
|----bpf_bpfeb.go
|----bpf_bpfeb.o
|----bpf_bpfel.go
|----bpf_bpfel.o
|----main.go
|____xdp.c    

0 directories,6 files

The ebpf program’s source code file,xdp.c in the diagram, is compiled using bpf2go, a code generation tool provided by cilium/ebpf. bpf2go uses the clang compiler to generate two ebpf bytecode files: “bpf_bpfeb.o” for big-endian and “bpf_bpfel.o” for little-endian systems. Additionally, bpf2go generates “bpf_bpfeb.go” or “bpf_bpfel.go” files based on the corresponding bytecode file. These go source files contain the ebpf program’s bytecode as binary data.

The “main.go” file is responsible for the user state of the ebpf program. Compiling “main.go” with either “bpf_bpfeb.go” or “bpf_bpfel.go” creates the final ebpf program.

Read more about bpf2go

Untitled-2023-03-22-2025

These files are part of the Cilium eBPF library and are used to compile, load and execute eBPF programs within the Cilium datapath.The two binary formats (bpfeb and bpfel) are used to represent eBPF bytecode in different endianness, depending on the target architecture.

  1. bpf_bpfeb.go and bpf_bpfeb.o are related to the big-endian eBPF (bpfeb) binary format. bpf_bpfeb.go is the Go language binding for the bpfeb binary format, while bpf_bpfeb.o is the actual binary file that contains the compiled eBPF bytecode in the bpfeb format.

  2. bpf_bpfel.go and bpf_bpfel.o are related to the little-endian eBPF (bpfel) binary format. bpf_bpfel.go is the Go language binding for the bpfel binary format, while bpf_bpfel.o is the actual binary file that contains the compiled eBPF bytecode in the bpfel format.

Headers

These are the headers provided by Cilium ebpf library.

  1. bpf_helpers.h: Defines helper functions provided by the kernel to eBPF programs, such as map lookup and modification, packet I/O operations, and synchronization primitives.
  2. bpf_endian.h: Provides conversion functions for different endianness of the data, as the eBPF program runs on a different endianness than the user space program.
  3. bpf_core_read.h: Provides functions for reading kernel data structures in eBPF programs, such as the sk_buff structure.
  4. bpf_core_write.h: Provides functions for writing to kernel data structures in eBPF programs, such as setting the return value of a system call.
  5. bpf_debug.h: Defines debugging helpers for eBPF programs, such as printing data and map contents.
  6. bpf_net_helpers.h: Provides helper functions for network-related tasks, such as TCP connection tracking and DNS lookup.
  7. bpf_time_helpers.h: Provides helper functions for timestamp and time conversion.

These headers are included in the Cilium eBPF library and can be used in eBPF C programs to interact with the kernel and perform various tasks.

Use Case

Building a Scalable Greeting Service with Temporal, FastAPI, Docker, and Traefik

In this post, we’ll walk through building a scalable greeting service using Temporal, a powerful orchestration framework, and FastAPI, a modern web framework for building APIs with Python. We’ll also containerize our application using Docker and set up a reverse proxy with Traefik for secure routing and load balancing. We’ll cover the code structure, key components, containerization, and how they work together to provide a robust and efficient service.

Project Structure

Here’s the structure of our project:

root
├── internal
│   ├── activity
│   │   └── name.py
│   ├── worker
│   │   ├── name.py
│   │   └── run.py
├── main.py
├── Dockerfile
└── docker-compose.yaml

Activities in Temporal

An activity in Temporal is a unit of work that can be executed independently. In our project, we define an activity to say hello in internal/activity/name.py.

from temporalio import activity

@activity.defn
async def say_hello(name: str) -> str:
    return f"Hello {name}!"

Workflows in Temporal

A workflow in Temporal orchestrates the execution of activities. We define a workflow to use our say_hello activity in internal/worker/name.py.

from temporalio import workflow
from datetime import timedelta
from internal.activity.name import say_hello

@workflow.defn
class GreetingWorkflow:
    @workflow.run
    async def run(self, name: str) -> str:
        return await workflow.execute_activity(
            say_hello, name, start_to_close_timeout=timedelta(seconds=120)
        )

Worker to Execute Workflows

Temporal workers are responsible for polling the Temporal server for tasks and executing workflows and activities. We set up a worker in internal/worker/run.py.

import asyncio
import concurrent.futures

from internal.activity.name import say_hello
from internal.worker.name import GreetingWorkflow
from temporalio.client import Client
from temporalio.worker import Worker

async def main() :
    client = await Client.connect('localhost:7233')

    with concurrent.futures.ThreadPoolExecutor(max_workers=1) as executor:
        worker = Worker(client, task_queue='name-task-queue', workflows=[GreetingWorkflow], activities=[say_hello], activity_executor=executor)
        await worker.run()

if __name__ == "__main__":
    asyncio.run(main())

FastAPI Application

We use FastAPI to expose our greeting service via HTTP endpoints. The main application is defined in main.py.

import logging
from contextlib import asynccontextmanager
from pydantic import BaseModel
from fastapi import FastAPI
from temporalio.client import Client
from internal.worker.name import GreetingWorkflow
import uvicorn

log = logging.getLogger(__name__)

class NameRequest(BaseModel):
    name: str

@asynccontextmanager
async def lifespan(app: FastAPI):
    logging.info("Setting up temporal client")
    app.state.temporal_client = await Client.connect('localhost:7233')
    yield

app = FastAPI(lifespan=lifespan)

@app.get('/', status_code=200, response_model=dict)
def root():
    return {"hello": "world"}

@app.post('/name', status_code=201, response_model=dict)
async def say_hello(request: NameRequest):
    result = await app.state.temporal_client.execute_workflow(
        GreetingWorkflow.run, request.name, id=f"name-workflow-{request.name}", task_queue='name-task-queue'
    )
    return {
        "result": result
    }

if __name__ == "__main__":
    uvicorn.run("main:app", reload=True, port=8000)

Containerization with Docker

We’ll use Docker to containerize our application. The Dockerfile defines the build process for both the FastAPI application and the Temporal worker.

# Use an official Python runtime as a parent image
FROM python:3.11-slim as base

# Set the working directory in the container
WORKDIR /app

# Copy the current directory contents into the container at /app
COPY . .

# Install any needed packages specified in requirements.txt
RUN pip install --no-cache-dir -r requirements.txt
    
# Multi-stage build to separate FastAPI and Temporal worker
# FastAPI stage
FROM base as fastapi

# Expose the port that the FastAPI app runs on
EXPOSE 8000

# Command to run FastAPI application
CMD ["python", "main.py"]

# Temporal worker stage
FROM base as worker

# Command to run the Temporal worker
CMD ["python", "internal/worker/run.py"]

Docker Compose for Orchestration

We use Docker Compose to define and run multi-container Docker applications. Our docker-compose.yaml file sets up the FastAPI app, the Temporal worker, and the Traefik reverse proxy.

version: "3.8"

services:
  reverse-proxy:
    image: traefik:v3.0.2
    container_name: "traefik"
    command:
      - --api.insecure=true
      - --providers.docker=true
      - --entrypoints.web.address=:80
      - --entrypoints.websecure.address=:443
      - --certificatesresolvers.myresolver.acme.tlschallenge=true
      - --certificatesresolvers.myresolver.acme.email=cimomof752@cnurbano.com
      - --certificatesresolvers.myresolver.acme.storage=/letsencrypt/acme.json
    ports:
      - "80:80"
      - "443:443"
      - "8080:8080"
    volumes:
      - ./letsencrypt:/letsencrypt
      - /var/run/docker.sock:/var/run/docker.sock:ro
    networks:
      - traefik-net

  fastapi:
    build:
      context: .
      dockerfile: Dockerfile
      target: fastapi
    ports:
      - "8000:8000"
    volumes:
      - .:/app
    labels:
      - "traefik.enable=true"
      - "traefik.http.routers.fastapi.rule=Host(`fastapi.localhost.com`)"
      - "traefik.http.routers.fastapi.entrypoints=websecure"
      - "traefik.http.routers.fastapi.tls.certresolver=myresolver"
      - "traefik.http.middlewares.redirect-to-https.redirectscheme.scheme=https"
      - "traefik.http.routers.redirs.rule=hostregexp(`{host:.+}`)"
      - "traefik.http.routers.redirs.entrypoints=web"
      - "traefik.http.routers.redirs.middlewares=redirect-to-https"
    networks:
      - traefik-net

networks:
  traefik-net:
    external: true

Running the Application with Traefik

  1. Start the Temporal Server: Ensure that your Temporal server is running on localhost:7233.
  2. Build and Run the Containers: Use Docker Compose to build and start the containers.
    docker-compose -f docker-compose.yaml up -d
    

Running the Application in local

Temporal Worker with FastAPI

create virtual environment

python -m venv .venv
source .venv/bin/activate

Install requirements

pip install -r requirements.txt

NOTE: TEMPORAL SHOULD BE INSTALLED IN THE VIRTUAL ENVIRONMENT

Run the temporal server in development mode

temporal server start-dev

temporal UI

Set Python Path and Run the Application

When running your scripts, make sure to set the PYTHONPATH so that Python can locate the internal module:

export PYTHONPATH=$(pwd)

Run the Temporal worker:

python internal/worker/run.py

Run the FastAPI application:

python main.py

python UI

Test the API

Test the API using curl or any HTTP client like Postman:

curl -X POST "http://127.0.0.1:8000/name" -H "Content-Type: application/json" -d '{"name": "Suresh"}'

You should receive a response like:

{
  "result": "Hello Suresh!"
}

swagger test

Check the workflows in the Temporal UI
http://localhost:8233/namespaces/default/workflows

workflow overview

Source Code: https://github.com/azar-writes-code/fastapi-traefik-temporal-poc

Conclusion

In this post, we’ve built a greeting service using Temporal for workflow orchestration, FastAPI for exposing our service via HTTP endpoints, Docker for containerization, and Traefik for reverse proxy and load balancing. This setup provides a scalable, secure, and reliable way to handle complex workflows in a microservices architecture. The combination of these technologies makes it a powerful solution for building modern web services.

Introduction

Overview

  1. Introduction to Temporal and Golang Gin Server
  2. Setting Up the Golang Project
  3. Integrating Temporal with Golang
  4. Creating and Running Temporal Workers
  5. Hosting the Application with Docker and Traefik

Introduction to Temporal and Golang Gin Server

Temporal is an open-source workflow orchestration engine that allows you to write fault-tolerant, scalable workflows in your code. Golang Gin server is a lightweight web framework for building web applications in Go. Traefik is a modern HTTP reverse proxy and load balancer that provides high performance, high availability, and easy configuration.

Introduction

Unveiling the Magic: A Comprehensive Guide to Traefik Reverse Proxy

In the ever-evolving landscape of modern application development, microservices architectures have become a dominant force. These distributed systems, composed of independent, loosely coupled services, offer numerous advantages – scalability, resilience, and faster development cycles. However, managing the complexities of routing traffic and ensuring seamless user access to these individual services can quickly become a challenge.

Enter Traefik, a lightweight and dynamic reverse proxy that acts as the maestro in your microservice orchestra. This open-source project, written in Go, simplifies the intricate task of routing traffic to the appropriate backend service while offering a plethora of functionalities that streamline application management.

Demystifying the Reverse Proxy: A Traffic Director

Before delving into Traefik’s capabilities, let’s establish a clear understanding of a reverse proxy. Unlike a forward proxy, which acts on behalf of a client to access external resources, a reverse proxy sits in front of your backend servers, directing incoming client requests to the appropriate service. It acts as a traffic director, ensuring requests reach the intended destination based on predefined rules.

This intermediary role offers several benefits:

  • Simplified Access: Users only need to interact with a single entry point, the reverse proxy, eliminating the need to manage individual service addresses.
  • Load Balancing: Traefik can distribute incoming traffic across multiple instances of a service, ensuring optimal performance and high availability.
  • Security Enhancements: The reverse proxy can act as a first line of defense, handling tasks like SSL termination and basic authentication, shielding backend services from potential security threats.
  • Centralized Configuration: Managing routing rules for all services within a single location, like Traefik’s configuration file, simplifies maintenance and reduces configuration sprawl.

Traefik: A Feature-Rich Powerhouse

Traefik goes beyond the basic functionalities of a reverse proxy, offering a robust set of features that make it a compelling choice for modern development workflows. Let’s explore some of its key advantages:

  • Dynamic Configuration: Gone are the days of manually editing configuration files for each service change. Traefik excels in dynamic discovery, automatically detecting new services running in your environment (like Docker containers) and configuring itself on the fly. This dynamic approach streamlines configuration management and minimizes manual intervention.
  • Provider Integration: Traefik seamlessly integrates with popular orchestration platforms like Docker Swarm, Kubernetes, and Consul. It leverages labels and tags associated with services within these platforms to automatically generate routing rules, further reducing configuration overhead.
  • Let’s Encrypt Integration: Obtaining and managing SSL certificates for your services can be a cumbersome task. Traefik integrates with Let’s Encrypt, a free and automated certificate authority, to handle certificate issuance and renewal automatically, ensuring secure HTTPS connections for your microservices.
  • Flexible Routing: Traefik offers a comprehensive set of routing options. You can define rules based on various parameters like path prefixes, subdomains, and headers, allowing for granular control over how traffic is directed to specific services.
  • Middleware Support: Traefik allows you to plug in custom middleware modules to extend its functionality. These modules can handle tasks like authentication, rate limiting, and request tracing, providing a powerful extension mechanism for enhancing your application infrastructure.
  • Monitoring and Metrics: Traefik provides built-in monitoring capabilities, offering insights into traffic patterns, service health, and overall system performance. This data can be invaluable for troubleshooting issues and optimizing your deployments.

The Benefits of Embracing Traefik

The advantages of incorporating Traefik into your microservice architecture are numerous. Here’s a glimpse of what you stand to gain:

  • Simplified Management: Traefik’s dynamic configuration and provider integration significantly reduce the manual effort required to manage your microservices. Less time spent on configuration translates to more time spent on development and innovation.
  • Improved Scalability: Traefik’s load balancing capabilities ensure traffic is distributed efficiently across your services, enabling your application to handle increasing workloads with ease.
  • Enhanced Security: Traefik’s integration with Let’s Encrypt simplifies the process of securing your services with HTTPS, while features like basic authentication add an extra layer of protection.
  • Increased Developer Productivity: By streamlining configuration and reducing manual intervention, Traefik empowers developers to focus on what they do best – building and maintaining the core functionalities of your application.

Getting Started with Traefik: A Smooth Onboarding

Traefik is designed to be a lightweight and user-friendly solution. Here’s a quick overview of how to get started:

  1. Download and Install: The installation process varies based on your chosen platform (bare metal, Docker, Kubernetes etc.). Refer to the official documentation https://doc.traefik.io/traefik/getting-started/quick-start/ for detailed instructions.
  2. Configuration: Traefik offers several configuration

Pre-requisites

To setup a temporal workflow, you will need to follow the steps below:

  1. Install Temporal CLI, download the version for your architecture. Once you’ve downloaded the file, extract the downloaded archive and add the temporal binary to your PATH by copying it to a directory like /usr/local/bin.

    go install github.com/temporalio/temporal@latest
    
  2. Create a temporal server

    temporal server start-dev
    

    This command starts a local Temporal Service. It starts the Web UI, creates the default Namespace, and uses an in-memory database.

    The Temporal Service will be available on localhost:7233. The Temporal Web UI will be available at http://localhost:8233.

Use Case

Setting Up the Golang Project

go.mod and go.sum

These files manage dependencies for the Go project. Here is a brief overview of the important dependencies in go.mod:

  • github.com/gin-gonic/gin: Gin framework for the web server.
  • go.temporal.io/sdk: Temporal Go SDK for creating workers and managing workflows.

Example of go.mod:

module your_module_name

go 1.16

require (
    github.com/gin-gonic/gin v1.7.7
    go.temporal.io/sdk v1.7.0
)

Integrating Temporal with Golang

Creating a Temporal Worker

A Temporal worker polls for workflow and activity tasks and executes them. Below is a simplified example of a worker setup:

package main

import (
    "go.temporal.io/sdk/client"
    "go.temporal.io/sdk/worker"
    "your_module_name/workflows"
)

func main() {
    // Create the client object just once per process
    c, err := client.Dial(client.Options{})
    if err != nil {
        panic(err)
    }
    defer c.Close()

    // Create a worker that listens on task queue "hello-world"
    w := worker.New(c, "hello-world", worker.Options{})

    // Register the workflow and activity function
    w.RegisterWorkflow(workflows.YourWorkflow)
    w.RegisterActivity(workflows.YourActivity)

    // Start listening to the task queue
    err = w.Run(worker.InterruptCh())
    if err != nil {
        panic(err)
    }
}

Defining Workflows and Activities

package workflows

import (
    "context"
    "go.temporal.io/sdk/workflow"
)

// YourActivity is an example of an activity function
func YourActivity(ctx context.Context, name string) (string, error) {
    return "Hello, " + name, nil
}

// YourWorkflow is an example of a workflow function
func YourWorkflow(ctx workflow.Context, name string) (string, error) {
    ao := workflow.ActivityOptions{
        StartToCloseTimeout: time.Minute,
    }
    ctx = workflow.WithActivityOptions(ctx, ao)

    var result string
    err := workflow.ExecuteActivity(ctx, YourActivity, name).Get(ctx, &result)
    if err != nil {
        return "", err
    }
    return result, nil
}

Creating and Running Temporal Workers

Dockerfile

The Dockerfile sets up the environment for running the Golang application, including the Temporal worker:

FROM golang:1.16

WORKDIR /app

COPY go.mod .
COPY go.sum .
RUN go mod download

COPY . .

RUN go build -o main .

CMD ["./main"]

docker-compose.yaml

This file sets up the necessary services, including the Temporal server and the Traefik reverse proxy:

version: '3.7'

services:
  temporal:
    image: temporalio/auto-setup:latest
    ports:
      - "7233:7233"
    environment:
      - TEMPORAL_CLI_ADDRESS=temporal:7233

  gin-server:
    build: .
    depends_on:
      - temporal
    ports:
      - "8080:8080"

  traefik:
    image: traefik:v2.2
    ports:
      - "80:80"
      - "8080:8080"
    command:
      - "--api.insecure=true"
      - "--providers.docker=true"
      - "--entrypoints.web.address=:80"
    volumes:
      - "/var/run/docker.sock:/var/run/docker.sock"

Hosting the Application with Docker and Traefik

Traefik is configured to route traffic to the Gin server. The docker-compose.yaml file ensures that the Temporal server, Gin server, and Traefik are properly set up and can communicate with each other.

Putting it All Together

Step-by-Step Guide

  1. Setup Project Structure:

    • Create a directory structure: cmd, pkg, workflows, etc.
    • Place your main application file in cmd.
  2. Define Workflows and Activities:

    • Create files in the workflows directory to define your Temporal workflows and activities.
  3. Create Dockerfile:

    • Write a Dockerfile to containerize your application.
  4. Setup Docker Compose:

    • Use docker-compose.yaml to set up services for Temporal, your Gin server, and Traefik.
  5. Run the Application:

    • Use docker-compose up to start all services.

Please find the source code here.

Conclusion

By following these steps, you will integrate Temporal with a Golang Gin server, create a worker using the Temporal Go SDK, and host the application using Traefik as a reverse proxy. This setup allows you to run workflows efficiently and scale as needed.

Understand Temporal workflow

Checkov Scan

Checkov Scanning Tool

Checkov is an open-source static analysis tool designed to identify security and compliance issues in infrastructure as code (IaC). It supports multiple cloud providers and configuration languages, making it a powerful tool for DevOps and security teams to ensure the security of their cloud infrastructure.

About the Pipeline

alt text

Table of Contents

Introduction

Checkov provides a comprehensive way to identify misconfigurations, insecure defaults, and other potential issues within your infrastructure code. It can be integrated into your CI/CD pipeline to ensure that your cloud deployments meet security and compliance standards before they are deployed.

Features

  • Multi-cloud support: Checkov supports popular cloud providers such as AWS, Azure, GCP, and more.
  • Configuration language support: It works with various infrastructure configuration languages, including Terraform, CloudFormation, Kubernetes YAML, and more.
  • Extensible: You can write custom policies to suit your organization’s specific security and compliance requirements.
  • CI/CD integration: Easily integrate Checkov into your CI/CD pipeline to automate security checks.
  • Easily actionable: Checkov provides clear guidance on the issues it identifies and suggests possible remediations.

Getting Started

Installation

To install Checkov, you can use pip:

pip install checkov
        or 
pip3 install checkov

Or, if you prefer using Docker:

docker pull bridgecrew/checkov

Usage

Using Checkov is straightforward. Simply navigate to your infrastructure code directory and run the following command:

checkov -d .

Replace the . with the path to your infrastructure code directory. Checkov will analyze your code and provide a report of any security issues it finds.

For more advanced usage and options, refer to the official Checkov Documentation.

Supported Cloud Providers Checkov supports a wide range of cloud providers, including but not limited to:

  • Amazon Web Services (AWS)
  • Microsoft Azure
  • Google Cloud Platform (GCP)
  • Kubernetes

For the complete list, refer to the Supported Cloud Providers in the documentation.

Checkov JSON Data Extraction and Storage

This guide outlines the process of extracting JSON data from the Checkov scanning tool’s output and storing it in a ClickHouse database. The Python script provided demonstrates how to extract relevant information from the JSON data, structure it, and insert it into the database.

Introduction

The Checkov scanning tool is used to identify security and compliance issues in Infrastructure as Code (IaC). This guide demonstrates how to extract relevant data from Checkov’s JSON output and store it in a ClickHouse database for further analysis and reporting.

Getting Started

Requirements

  • Checkov JSON output file
  • Python
  • ClickHouse database
  • ClickHouse Python driver (clickhouse-connect)

Process Overview

  1. Extract JSON data from the Checkov output.
  2. Process the JSON data to extract relevant information.
  3. Store the extracted information in a ClickHouse database.

Extraction and Storage Process

Extracting Data

The Python script reads the Checkov JSON data, extracts information about passed and failed checks, and structures the data for insertion.

Storing Data in ClickHouse

The processed data is inserted into a ClickHouse table with the following fields:

  • id: UUID generated for each row
  • timestamp: Date and time of insertion
  • check_id: Check ID from Checkov
  • bc_check_id: Bridgecrew check ID
  • check_name: Name of the check
  • status: Result of the check (passed/failed)
  • evaluated_keys: Evaluated keys from the check

The script uses the ClickHouse Python driver to establish a connection to the database and insert the processed data.

For detailed step-by-step instructions and the Python script, refer to the provided code.

Checkov Grafana Output

alt text

Conclusion

Checkov is an indispensable tool for enhancing security and compliance in infrastructure as code. With multi-cloud support, compatibility with various configuration languages, and seamless CI/CD integration, it’s a valuable asset for DevOps and security teams.

The Checkov JSON Data Extraction and Storage guide offers a way to extract and store critical information from Checkov’s output in ClickHouse. This enables better analysis and reporting of security and compliance data.

By leveraging Checkov and data extraction, organizations can bolster their infrastructure security, ensuring deployments meet stringent standards and are protected from vulnerabilities.

FluentBit

Fluentbit –> ClickHouse –> Grafana

Table of Contents

FluentBit

Fluent Bit is an open-source tool designed for efficiently collecting and processing log data. It was created in 2015 by Treasure Data. This software is particularly well-suited for highly distributed environments where minimizing resource usage (like memory and CPU) is crucial. Fluent Bit is known for its high performance and has a small memory footprint, using only about 450KB. It employs an abstracted I/O handler for asynchronous and event-driven read/write operations, and offers various configuration options for ensuring reliability and resilience in log handling.

Fluent Bit Data Pipeline

Fluent Bit collects and process logs (records) from different input sources and allows to parse and filter these records before they hit the Storage interface. Once data is processed and it’s in a safe state (either in memory or the file system), the records are routed through the proper output destinations.

alt text

Fluent Bit Helm chart

Fluent Bit is a fast and lightweight log processor and forwarder or Linux, OSX and BSD family operating systems.

Installation

To add the fluent helm repo, run:

helm repo add fluent https://fluent.github.io/helm-charts

To install a release named fluent-bit, run:

helm install fluent-bit fluent/fluent-bit

Chart values

helm show values fluent/fluent-bit

Using Lua scripts

Fluent Bit allows us to build filter to modify the incoming records using custom Lua scripts.

How to use Lua scripts with this Chart

First, you should add your Lua scripts to luaScripts in values.yaml

luaScripts:
  functions.lua: |
    function set_fields(tag, timestamp, record)
          record['host'] = record['log']['kubernetes']['host']
          record['log']['kubernetes']['host'] = nil
          record['pod_name'] = record['log']['kubernetes']['pod_name']
          record['log']['kubernetes']['pod_name'] = nil
          return 2, timestamp, record
    end    

This Lua script reorganizes log records from Kubernetes. It extracts and reassigns the host and pod_name fields for easier access, and then removes the original nested fields to streamline the log record. This helps in processing and storing logs in a more organized format.

After that, the Lua scripts will be ready to be used as filters. So next step is to add your Fluent bit filter to config.filters in values.yaml, for example:

config:
## https://docs.fluentbit.io/manual/pipeline/filters
  filters: |
    
    [FILTER]
        Name kubernetes
        Match kube.*
        Merge_Log On
        Keep_Log Off
        K8S-Logging.Parser On
        K8S-Logging.Exclude On
    
    [FILTER]
        Name nest
        Match *
        Operation nest
        Wildcard *
        Nest_under log

    [FILTER]
        Name lua
        Match *
        script /fluent-bit/scripts/functions.lua
        call set_fields    

In this Fluent Bit configuration, a series of filters are applied to enhance the handling and structure of logs.

First, there’s the Kubernetes Filter. This filter is crucial for managing logs originating from Kubernetes environments. It specializes in tasks like handling multi-line logs and parsing out essential information unique to Kubernetes. By merging certain log entries and excluding unnecessary fields, it ensures that the logs are more organized and insightful.

Next, we have the Nest Filter. Its purpose is to tidy up log data by grouping related fields together under a common parent field. This helps in keeping the log records well-organized and easy to read.

Finally, the Lua Filter introduces an extra layer of customization. It allows for the application of custom Lua scripts to modify log records dynamically. In this specific setup, it calls a function called set_fields defined in a Lua script. This function is responsible for extracting and reorganizing crucial fields like host and pod_name. By applying this Lua script, the logs are tailored to better suit the specific needs of the environment.

Under the hood, the chart will:

  • Create a configmap using luaScripts.
  • Add a volumeMounts for each Lua scripts using the path /fluent-bit/scripts/<script>.
  • Add the Lua script’s configmap as volume to the pod.

Note

Remember to set the script attribute in the filter using /fluent-bit/scripts/, otherwise the file will not be found by fluent bit.

Clickhouse Output in FluentBit

## https://docs.fluentbit.io/manual/pipeline/outputs
outputs: |
  [OUTPUT]
    name http
    tls on
    match *
    host <YOUR CLICKHOUSE CLOUD HOST>
    port 8123
    URI /?query=INSERT+INTO+fluentbit.kube+FORMAT+JSONEachRow
    format json_stream
    json_date_key timestamp
    json_date_format epoch
    http_user default
    http_passwd <YOUR PASSWORD>  

This configuration block in Fluent Bit sets up an output to send processed log data to a ClickHouse database. It uses TLS for secure communication and specifies the ClickHouse host, port, and URI for data insertion. The logs are formatted as JSON and authentication is provided via a username and password.

Creating a ClickHouse Table

In the previously discussed Fluent Bit configuration, we included a URI for data insertion. Now, let’s proceed to set up the corresponding table in ClickHouse.

Below is the essential information:

URI /?query=INSERT+INTO+fluentbit.kube+FORMAT+JSONEachRow

This URI directs Fluent Bit to insert log data into the ClickHouse table named fluentbit.kube using the JSONEachRow format. This step is crucial for effectively storing and managing your Kubernetes logs.

If haven’t created the Database, So please create it.

CREATE DATABASE fluentbit

After creating the database, we are required to enable the JSON object type via the experimental flag allow_experimental_object_type, or in ClickHouse Cloud opening a support case:

SET allow_experimental_object_type = 1

Once set, we can create the table with the provided structure. Note how we specify our primary key via the ORDER BY clause. Explicitly declaring our host and pod_name columns on the root of the message, rather than relying on ClickHouse to infer them dynamically as simply String within the JSON column, allows us to define their types more tightly - for both we use LowCardinality(String) improving their compression and query performance due to reduced IO. We create the usual log column which will contain any other fields in the message.

CREATE TABLE fluentbit.kube
(
    timestamp DateTime,
    log JSON,
    host LowCardinality(String),
    pod_name LowCardinality(String)
)
Engine = MergeTree ORDER BY tuple(host, pod_name, timestamp)

Once created, we can deploy Fluent Bit to send our Kubernetes logs.

To confirm successful installation, list the pods in the default namespace. Note your namespace and response may vary in production environments.:

$ kubectl get pods -n qw

NAME                         READY   STATUS    RESTARTS   AGE
fluentbit-fluent-bit-lb5cx   1/1     Running   0          23h

After a few minutes we should begin to see logs start to flow to ClickHouse. From the clickhouse-client we perform a simple SELECT. Note the FORMAT option is required to return rows in JSON format and we focus on log messages where a host and pod_name could be extracted.

SET output_format_json_named_tuples_as_objects = 1
SELECT * FROM fluentbit.kube LIMIT 10 FORMAT JSONEachRow
clickhouse-client :) SELECT * FROM fluentbit.kube WHERE host != '' AND pod_name != '' LIMIT 2 FORMAT JSONEachRow

SELECT *
FROM fluentbit.kube
WHERE (host != '') AND (pod_name != '')
LIMIT 1
FORMAT JSONEachRow

You get the complete log of that Pod.

Visualizing the Kubernetes data

  • You have to configure the Clickhouse as Data Source in Grafana.

alt text

Conclusion

This guide demonstrated how to build an efficient logging pipeline using Fluent Bit, ClickHouse, and Grafana. Fluent Bit’s lightweight nature and Lua scripting capabilities enhance log processing. ClickHouse provides a robust storage solution, while Grafana offers powerful visualization tools. This setup ensures effective monitoring and troubleshooting of Kubernetes environments.

Kubescape

Kubescape - Kubernetes Cluster Security Scanning Tool

Kubescape is an open-source tool designed to assess the security posture of Kubernetes clusters. It evaluates clusters against multiple security benchmarks, helping you identify potential misconfigurations and vulnerabilities.

About the Pipeline

alt text

Table of Contents

Features

  • Evaluate Kubernetes clusters against popular security benchmarks.
  • Identify misconfigurations, vulnerabilities, and risks.
  • Generate detailed reports for analysis and remediation.
  • Integration with CI/CD pipelines for automated security testing.
  • Customizable to focus on specific checks and benchmarks.

Prerequisites

  • Kubernetes cluster to scan.
  • kubectl command-line tool installed and configured.

Installation

  1. Clone the Kubescape repository:
   git clone https://github.com/armosec/kubescape.git
   cd kubescape
  1. Run Kubescape using Docker:

    • Ensure that you have the kubectl command-line tool installed and configured to access your Kubernetes cluster.
    • Run the following Docker command to perform a security scan using Kubescape:
    docker run --rm -v ~/.kube:/app/.kube -it armosec/kubescape
    

    The -v ~/.kube:/app/.kube option mounts your local ~/.kube directory (which contains your kubeconfig) to the container’s /.kube directory, enabling Kubescape to interact with your Kubernetes cluster.

  2. Kubescape will perform the security scan on your Kubernetes cluster and generate a report with findings and recommendations.

    Note: You can customize the scan by providing additional flags, such as specific checks or benchmarks to run. Refer to the official documentation for more details.

Usage

After completing the installation steps, you can use Kubescape to assess the security posture of your Kubernetes cluster. Run the following command to initiate a security scan:

kubescape scan --kubeconfig cluster.conf

Replace cluster.conf file with your kubeconfig file.

Integration with CI/CD

You can integrate Kubescape into your CI/CD pipelines to automate security checks for every deployment:

  1. Install Kubescape within your CI/CD environment.
  2. Use kubectl to apply your Kubernetes manifests.
  3. Run Kubescape scans using appropriate flags and settings.
  4. Parse the generated report for findings and recommendations.
  5. Fail the pipeline or trigger alerts based on the scan results.

Customization

Kubescape offers various customization options to tailor the scan to your needs. You can specify specific checks, benchmarks, or namespaces to scan. Refer to the official documentation for detailed customization instructions.

Kubescape Data Processing and ClickHouse Insertion

This repository contains a set of scripts designed to process JSON data generated by the Kubescape tool and insert the relevant information into a ClickHouse database. The scripts are intended to help store and analyze security assessment data of Kubernetes clusters.

Prerequisites

  • Python 3.x installed
  • Accessible ClickHouse server
  • Required Python libraries installed (see requirements.txt)

Overview

The provided scripts serve the following purposes:

Data Processing (process_json_data.py)

This script processes the JSON data generated by Kubescape. It extracts relevant information such as cluster name, control details, status, scores, and compliance scores. The extracted data is organized and prepared for insertion into the ClickHouse database.

ClickHouse Database Interaction (clickhouse_connect.py)

The clickhouse_connect.py script handles the connection to the ClickHouse database. It retrieves connection details from environment variables and establishes a connection to the ClickHouse server. This connection is crucial for inserting processed data into the database.

Storing data in ClickHouse DB

  • Cluster name: The name of the Kubernetes cluster that is being scanned.
  • Generation time: The time at which the scan was generated.
  • Control ID: The unique identifier for the control that was scanned.
  • Control name: The name of the control that was scanned.
  • Status: The status of the control, such as “PASSED”, “FAILED”, or “NA”.
  • Score: The score for the control, out of 100.
  • Compliance score: The compliance score for the control, out of 100.
  • Score factor: The score factor for the control, which is used to calculate the overall compliance score for the cluster.

Main Execution (main.py)

The main.py script orchestrates the data processing and ClickHouse insertion. It reads the JSON data from a specified file, processes the data using the process_json_data function, and inserts the processed data into the ClickHouse database using the ClickHouse client provided by clickhouse_connect.

Usage

  1. Ensure that you have Python 3.x installed on your system.

  2. Set up the required environment variables in a .env file. These variables include ClickHouse connection details and the path to the JSON data file.

  3. Install the necessary Python libraries using the provided requirements.txt file:

    pip install -r requirements.txt
    
  4. Run the main.py script to process the JSON data and insert it into the ClickHouse database:

    python main.py
    

Customization

  • Modify the process_json_data function in process_json_data.py to handle additional data points or customize the extraction process.
  • Adjust the ClickHouse table schema in main.py based on your data storage requirements.

Kubescape scan Results in Grafana

alt text

Conclusion

Kubescape is a valuable open-source tool for enhancing Kubernetes cluster security. It efficiently assesses clusters against security benchmarks, pinpointing vulnerabilities and misconfigurations. The tool’s integration into CI/CD pipelines automates security checks, and its customization options enable tailored assessments. With clear installation and usage instructions, Kubescape empowers users to bolster their Kubernetes security posture effectively. Additionally, the provided data processing and ClickHouse insertion scripts offer a streamlined way to store and analyze security assessment data, contributing to a comprehensive security strategy.

Quickwit

Getting Started with Quickwit

Table of Contents

What is Quickwit

Quickwit is an open-source search engine designed for building search applications. It’s specifically designed for applications with large-scale indexing needs and distributed search capabilities. Quickwit is built to be flexible, high-performance, and easy to scale.

Here are key features of Quickwit

Distributed Search: Quickwit allows you to distribute your search infrastructure across multiple nodes, enabling you to handle large datasets and high query volumes.

Efficient Indexing: It supports efficient indexing of large-scale datasets with features like sharding and parallelism.

Schema Flexibility: Quickwit is schema-agnostic, meaning you don’t need to pre-define your data schema. It adapts to your data on-the-fly.

Real-time Ingestion: It supports real-time data ingestion, allowing your search results to be up-to-date with your data sources.

RESTful API and gRPC Interface: Quickwit provides both RESTful API and gRPC interfaces, making it versatile and suitable for various application architectures.

Built-in Query Language: It comes with a query language that supports features like full-text search, faceting, and filtering.

Log Management with Quickwit

Log management is a critical aspect of maintaining robust and efficient systems. Quickwit simplifies this process by seamlessly integrating with popular log agents like OpenTelemetry (OTEL) Collector, Vector, Fluentbit, and Logstash.

alt text

OpenTelemetry (OTEL) Collector: OTEL Collector is a versatile agent capable of collecting logs from various sources. Configured to transform and send logs to Quickwit, it streamlines the process of log ingestion and indexing.

Vector: Vector is a high-performance, open-source log agent with support for a wide range of sources and destinations. By configuring Vector to collect logs and forward them to Quickwit, you can ensure efficient log management.

Fluentbit: Fluentbit is a lightweight and efficient log collector that excels in environments where resource usage is a concern. It can be configured to gather logs from diverse sources and send them to Quickwit for indexing.

Logstash: While not explicitly mentioned, Logstash remains a viable option for log collection. It can be configured to seamlessly send logs to Quickwit for comprehensive log management.

Log Management in Quickwit using Fluentbit

alt text

Setting up Quickwit and Fluentbit

  • Deploy Quickwit
  • Create fluentbit Index in Quickwit
  • Deploy Fluentbit
  1. Install Quickwit
apiVersion: apps/v1
kind: Deployment
metadata:
  name: quickwit
spec:
  replicas: 1
  selector:
    matchLabels:
      app: quickwit
  template:
    metadata:
      labels:
        app: quickwit
    spec:
      volumes:
        - name: config-volume
          configMap:
            name: quickwit-config  # Name of the ConfigMap
      containers:
        - name: quickwit
          image: quickwit/quickwit:latest
          command: ["quickwit", "run"]  # Added command to run Quickwit
          ports:
            - containerPort: 7280  # Add this line to expose port 7280
            - containerPort: 7281  # Add this line to expose port 7281          
          volumeMounts:
            - name: config-volume
              mountPath: /quickwit/config  # Mount path inside the container
          env:
            - name: QW_CONFIG
              value: /quickwit/config/quickwit.yaml
---
apiVersion: v1
kind: Service
metadata:
  name: quickwit
spec:
  selector:
    app: quickwit
  ports:
    - protocol: TCP
      port: 7280
      targetPort: 7280
      nodePort: 30080  # Define a NodePort for port 7280
      name: restapi
    - protocol: TCP
      port: 7281
      targetPort: 7281
      nodePort: 30081  # Define a NodePort for port 7281
      name: grpc
  type: NodePort  # Change service type to NodePort
---
apiVersion: v1
data:
  quickwit.yaml: |
    # -------------------------------- General settings --------------------------------
    version: 0.6
    default_index_root_uri: s3://<Bucket Name>/quickwit-indexes
    storage:
      s3:
        endpoint: "https://s3.us-east-1.amazonaws.com"
        region: us-east-1
        access_key_id: ""
        secret_access_key: ""

    indexer:
      enable_otlp_endpoint: true

    jaeger:
      enable_endpoint: ${QW_ENABLE_JAEGER_ENDPOINT:-true}    
kind: ConfigMap
metadata:
  name: quickwit-config

Note: Please provide your S3 Storage details in above configmap.

kubectl create -f <file name> -n <Namespace>
  1. Create a simple index for Fluentbit logs

Add below yaml file in fluentbit-logs.yaml file.


version: 0.6

index_id: fluentbit-logs

doc_mapping:
  mode: dynamic
  field_mappings:
    - name: timestamp
      type: datetime
      input_formats:
        - unix_timestamp
      output_format: unix_timestamp_secs
      fast: true
  timestamp_field: timestamp

indexing_settings:
  commit_timeout_secs: 10

And then create the index with cURL:

curl -XPOST http://<QUICKWIT URL>:7280/api/v1/indexes -H "content-type: application/yaml" --data-binary @fluentbit-logs.yaml

Fluentbit configuration file is made of inputs and outputs. For this tutorial, we will use a dummy configuration:

[INPUT]
  Name   dummy
  Tag    dummy.log
  • Name: Specifies the input plugin to be used. In this case, it’s using the dummy plugin, which generates dummy log data.

  • Tag: Tags are used to categorize logs. In this case, the tag dummy.log is assigned to the generated dummy logs.

[OUTPUT]
  Name http
  Match *
  URI   /api/v1/fluentbit-logs/ingest
  Host  <quickwit-service>.<Namespace>.svc.cluster.local
  Port  7280
  tls   Off
  Format json_lines
  Json_date_key    timestamp
  Json_date_format epoch
  • Name: Specifies the output plugin to be used. In this case, it’s using the http plugin, which allows Fluentbit to send logs over HTTP.
  • Match *: Defines the pattern for which logs should be sent to this output. In this case, * is a wildcard, meaning all logs will be sent.
  • URI: The endpoint where the logs will be sent. In this example, logs will be sent to /api/v1/fluentbit-logs/ingest.
  • Host and Port: Specify the destination address and port for the HTTP request. In this case, it’s localhost and port 7280.
  • tls: Indicates whether Transport Layer Security (TLS) is enabled or not. In this example, it’s set to Off, meaning no encryption is used.
  • Format: Specifies the format in which logs will be sent. In this case, it’s using json_lines, which is a JSON format.
  • Json_date_key and Json_date_format: These settings are specific to the JSON format. They define how timestamps are handled in the JSON logs.

What are we getting from above Config?

In this configuration, generating dummy logs and sending them to a specified endpoint (/api/v1/fluentbit-logs/ingest). These logs will be sent in JSON format over HTTP to the designated address (quickwit.namespace.svc.cluster.local:7280). The logs will contain a timestamp, along with other dummy data generated by the dummy plugin.

  1. Install Fluentbit

Installing with Helm Chart

helm repo add fluent https://fluent.github.io/helm-charts
helm upgrade --install fluent-bit fluent/fluent-bit --values <values.yaml>

Note: Please add the INPUT and OUTPUT configuration in values.yaml and install Fluent-bit.

Search Logs

Quickwit is now ingesting logs coming from Fluentbit and you can search them either with curl or by using the UI:

curl "http://127.0.0.1:7280/api/v1/fluentbit-logs/search?query=severity:DEBUG"

Open your browser at http://127.0.0.1:7280/ui/search?query=severity:DEBUG&index_id=fluentbit-logs&max_hits=10.

Note: Port forward or expose the Quickwit service then search the logs in Browser.

alt text

S3 Storage

Once Quickwit and Fluentbit are properly configured and integrated, you will be able to observe the logs seamlessly flowing into your designated S3 bucket for storage and further analysis.

alt text

Grafana Visualization

Prerequisites

  • Install Grafana
  • Setup Quickwit Datasource in Grafana

Setup Quickwit Datasource

Requirements

Grafana Dashboard

alt text alt text

Reference URLs:

Quickwit Documentation Fluentbit Documentation

Conclusion:

Incorporating Quickwit into your log management pipeline brings forth a powerful search engine capable of handling large-scale indexing and distributed search needs. With seamless integration options for popular log agents like OpenTelemetry (OTEL) Collector, Vector, Fluentbit, and Logstash, Quickwit ensures efficient log ingestion and indexing. By following the steps outlined in this guide, you’ve set up a robust log management system that not only enables real-time data ingestion but also provides flexible querying capabilities. With the ability to effortlessly visualize logs in Grafana, you have a comprehensive solution at your disposal for effective log management.

Setting up Tekton Pipeline

Tekton Pipeline

Description

This pipeline performs a series of tasks related to source code management, Docker image building, scanning, and signing.

Parameters

  • repo-url: The URL of the Git repository to clone.
  • revision: The revision to use.
  • PARAM_SCM: Source Code Management URL (default: github.com).
  • pathToContext: Path to the build context (default: src).
  • imageUrl: Image name including repository.
  • imageTag: Image tag (default: latest).
  • STORAGE_DRIVER: Storage driver to use (default: vfs).
  • trivy-args: Arguments for Trivy scanner (default: [’–format json’]).
  • TRIVY_EXIT_CODE: Exit code if critical vulnerabilities are found.
  • syft-args: Arguments for Syft scanner (default: [’target/images/docker-image-local.tar’, ‘-o syft-json’]).
  • grype-args: Arguments for Grype scanner (default: [’target/images/docker-image-local.tar’, ‘-o json’]).
  • SBOM_FORMAT: Software Bill of Materials format (default: spdx-json).

Workspaces

  • shared-data: Contains the cloned repository files.
  • git-credentials: Basic authentication for Git.
  • sonar-project.properties: Sonar details for scanning and pushing results to SonarCloud.
  • sonar-token: Sonar authentication token.
  • dockerconfig: Docker configuration.
  • cosign: Cosign configuration (private key).
  • cosign-pub: Cosign configuration (public key).
  • docker-credentials: Docker credentials.
  • clickhouse: Clickhouse database connection.
  • python-clickhouse: Python Clickhouse valuse.

Tasks

1. fetch-source

  • Description: Clones the Git repository.
  • Parameters:
    • url: $(params.repo-url)
    • PARAM_SCM: $(params.PARAM_SCM)
    • revision: $(params.revision)

2. sonarqube-scanner

  • Description: Runs SonarQube scanner.
  • Dependencies: fetch-source
  • Workspaces:
    • source: shared-data
    • sonar-settings: sonar-project.properties
    • sonar-token: sonar-token

3. build-dockerfile

  • Description: Builds the Docker image.
  • Dependencies: fetch-source, sonarqube-scanner
  • Workspaces:
    • source: shared-data
    • dockerconfig: docker-credentials
  • Parameters:
    • CONTEXT: $(params.pathToContext)
    • IMAGE: $(params.imageUrl):$(params.imageTag)

4. trivy-scanner

  • Description: Scans the Docker image using Trivy.
  • Dependencies: build-dockerfile
  • Workspaces:
    • manifest-dir: shared-data
  • Parameters:
    • IMAGE_PATH: $(params.imageUrl):$(params.imageTag)
    • ARGS: $(params.trivy-args[*])
    • EXIT_CODE: $(params.TRIVY_EXIT_CODE)

5. buildah-push

  • Description: Pushes the Docker image to a registry.
  • Dependencies: trivy-scanner
  • Workspaces:
    • source: shared-data
    • dockerconfig: docker-credentials
  • Parameters:
    • CONTEXT: $(params.pathToContext)
    • IMAGE: $(params.imageUrl):$(params.imageTag)
    • STORAGE_DRIVER: $(params.STORAGE_DRIVER)

6. trivy-sbom

  • Description: Generates a Software Bill of Materials using Trivy.
  • Dependencies: buildah-push
  • Workspaces:
    • manifest-dir: shared-data
    • clickhouse: clickhouse
    • python-clickhouse: python-clickhouse
  • Parameters:
    • IMAGE: $(params.imageUrl)
    • DIGEST: $(tasks.buildah-push.results.IMAGE_DIGEST)
    • format: $(params.SBOM_FORMAT)

7. cosign-sign

  • Description: Signs the Docker image using Cosign.
  • Dependencies: buildah-push
  • Workspaces:
    • source: shared-data
    • dockerconfig: dockerconfig
    • cosign: cosign
  • Parameters:
    • image: “$(params.imageUrl)@$(tasks.buildah-push.results.IMAGE_DIGEST)”

8. cosign-image-verify

  • Description: Verifies the signed Docker image using Cosign.
  • Dependencies: cosign-sign
  • Workspaces:
    • source: shared-data
    • dockerconfig: dockerconfig
    • cosign: cosign-pub
  • Parameters:
    • image: “$(params.imageUrl)@$(tasks.buildah-push.results.IMAGE_DIGEST)”

Terraform Linting using Tflint

Mastering Terraform with tflint: Your Ultimate Guide

Terraform is a powerful tool for managing infrastructure as code, but writing efficient and error-free configurations can be challenging. Enter tflint - a static analysis tool designed specifically for Terraform. In this blog post, we’ll explore the features, benefits, and best practices for using tflint to supercharge your Terraform workflows.

What is tflint?

tflint is an open-source static analysis tool for Terraform configurations. It performs various checks on your Terraform code to identify errors, enforce best practices, and ensure adherence to style conventions. This tool is invaluable for maintaining clean, efficient, and secure infrastructure code.

Key Features

1. Syntax Checking

tflint verifies your Terraform configurations for syntax errors and common mistakes. It helps catch issues early in the development process, saving you time and preventing potential deployment failures.

2. Style Enforcement

Consistent coding style is crucial for readability and maintainability. tflint enforces style conventions, ensuring that your codebase remains clean, organized, and easy to understand.

3. Security Checks

While not primarily a security tool, tflint can identify certain security-related issues, such as sensitive data exposure or resource misconfigurations.

4. Plugin System

Extend tflint with plugins to customize its behavior or integrate it into your existing workflows. This allows you to tailor the tool to your specific requirements.

5. CI/CD Integration

Integrate tflint seamlessly into your CI/CD pipelines. Automate checks during the deployment process to catch issues early and ensure only quality code is deployed.

Getting Started with tflint

Installation

To get started with tflint, you’ll need to install it on your system. You can find installation instructions for various platforms on the official GitHub repository: https://github.com/terraform-linters/tflint .

Running tflint

Once installed, running tflint is as simple as navigating to your Terraform project directory and executing:

tflint

tflint will scan your configurations and provide a detailed report highlighting any identified issues.

Conclusion

Using tflint is a game-changer for Terraform developers. It empowers you to write cleaner, more efficient, and error-free code, ultimately leading to more reliable and secure infrastructure deployments.

Remember, tflint is just one component of a robust Terraform development workflow. Pair it with other best practices such as version control, automated testing, and code reviews for a comprehensive approach to infrastructure as code.

Get started with tflint today and elevate your Terraform development experience!


Note: Always ensure you have the latest version of tflint and refer to the official documentation for the most up-to-date information and best practices.

BUNjs

alter-text

If you’re a JavaScript developer, you’re probably familiar with Node.js, the popular runtime environment that allows you to run JavaScript code on the server-side. But have you heard of BunJS? It’s the latest addition to the JavaScript runtime family, and it’s making waves in the developer community. In this blog post, we’ll delve into what BunJS is all about and why it’s gaining traction.

What is BunJS?

BunJS is a revolutionary JavaScript runtime designed from the ground up to cater to the modern JavaScript ecosystem. It was created with three major design goals in mind:

  1. Speed: BunJS is all about speed. It starts fast and runs fast, thanks to its foundation on JavaScriptCore, the high-performance JavaScript engine originally built for Safari. In a world where edge computing is becoming increasingly important, speed is a critical factor.

  2. Elegant APIs: BunJS provides a minimal set of highly optimized APIs for common tasks like starting an HTTP server and writing files. It streamlines the development process by offering clean and efficient APIs.

  3. Cohesive Developer Experience (DX): BunJS is more than just a runtime; it’s a complete toolkit for building JavaScript applications. It includes a package manager, test runner, bundler, and more, all aimed at enhancing developer productivity.

How Does BunJS Work?

At the core of BunJS is its runtime, which is designed as a drop-in replacement for Node.js. This runtime is not only fast but also memory-efficient, thanks to its implementation in Zig and its use of JavaScriptCore under the hood. It dramatically reduces startup times and memory usage, making your applications snappier and more resource-friendly.

BunJS also comes with a powerful command-line tool named bun. This tool serves as a test runner, script executor, and Node.js-compatible package manager. The best part is that you can seamlessly integrate bun into existing Node.js projects with minimal adjustments.

Here are some common bun commands:

  • bun run index.ts: Execute TypeScript files out of the box.
  • bun run start: Run the start script.
  • bun add <pkg>: Install a package.
  • bun build ./index.tsx --outdir ./out: Bundle a project for browsers.
  • bun test: Run tests.
  • bunx cowsay "Hello, world!": Execute a package.

BunJS - The Current State

While BunJS shows immense promise, it’s worth noting that it’s still under development. However, you can already benefit from it in various ways. It can speed up your development workflows and run less complex production code in resource-constrained environments like serverless functions.

The BunJS team is actively working on achieving full Node.js compatibility and integrating with existing frameworks. To stay updated on future releases and developments, you can join their Discord community and monitor their GitHub repository.

Getting Started with BunJS

If you’re intrigued by BunJS and want to give it a try, here are some quick links to get you started:

What Makes a Runtime?

Before we wrap up, let’s briefly touch on what a runtime is in the context of JavaScript. JavaScript, or ECMAScript, is a language specification. It defines the rules and syntax for the language. However, to perform useful tasks, JavaScript programs need access to the outside world. This is where runtimes come into play.

Runtimes implement additional APIs that JavaScript programs can use. For example, web browsers have JavaScript runtimes that provide web-specific APIs like fetch, WebSocket, and ReadableStream. Similarly, Node.js is a JavaScript runtime for server-side environments, offering APIs like fs, path, and Buffer.

BunJS is designed as a faster, leaner, and more modern replacement for Node.js, with an emphasis on speed, TypeScript and JSX support, ESM and CommonJS compatibility, and Node.js compatibility.

Conclusion

BunJS 1.0 is an exciting addition to the world of JavaScript runtimes. Its focus on speed, elegant APIs, and developer experience makes it a promising choice for modern JavaScript development. While it’s still evolving, it’s already making a significant impact in the JavaScript ecosystem.

If you’re tired of the sluggishness of your current runtime or want to explore a more efficient and developer-friendly option, give BunJS a try. With its forward-looking approach and commitment to performance, it might just be the future of server-side JavaScript.

Gitsign

Signing your development work is the new Industry standard, per Software Supply Chain Security measures. Gitsign makes developer’s life easy to sign the commits by providing key pair based mode and keyless mode to sign Git commits with a mechanism to verify the signatures. This document is a step-by-step guide on setting up Gitsign globally for all commits in your local and how to verify the commits using Git and Gitsign; the signing procedure we adopted is keyless mode, hence will demonstrate it.

Before Git Sign

Lets see what it looks like before you have setup a Global Git Sign. Let’s do an empty commit with the message "UmsignedCommit".

git commit --allow-empty -m "UmsignedCommit"

You should see something like this,

[main 14ee0af] UmsignedCommit

Let’s push the commit to remote Github Repository

root@835a70e3cec7:/end_to_end_ML_model# git push origin main
Enumerating objects: 1, done.
Counting objects: 100% (1/1), done.
Writing objects: 100% (1/1), 211 bytes | 211.00 KiB/s, done.
Total 1 (delta 0), reused 0 (delta 0), pack-reused 0
To github.com:VishwasSomasekhariah/end_to_end_ML_model.git
   b9de83c..14ee0af  main -> main

No authentication was requested and no signature was signed for this work, hence cannot verify who really did the commit. You can check this on Github. github_unsigned_commit

Install Gitsign using Homebrew

You can find steps for other platforms’ installation on SigStore Docs .

If you have homebrew, use brew tap to add Sigstore’s repository to your system

brew tap sigstore/tap

Use brew install to install gitsign using homebrew

brew install gitsign 

Install Gitsign using .deb package if on Ubuntu

If you are on a linux machine like me, you can use wget to download the .deb or .rpm files. Here is a list of releases . Please download the right one based on your system.

wget https://github.com/sigstore/gitsign/releases/download/v0.7.1/gitsign_0.7.1_linux_amd64.deb

You should see the package downloaded in your PWD PWD Use the downloaded file to install gitsign.

dpkg -i gitsign_0.7.1_linux_amd64.deb

You should be seeing this for successful installation

Selecting previously unselected package gitsign.
(Reading database ... 11084 files and directories currently installed.)
Preparing to unpack gitsign_0.7.1_linux_amd64.deb ...
Unpacking gitsign (0.7.1) ...
Setting up gitsign (0.7.1) ...

Verify the gitsign installation typing gitsign --version

gitsign version v0.7.1

Configuring gitsign for all globally

Meaning every project that you contribute to, would be signed using gitsign automatically taking away the hassle to remember it for each repository.

git config --global commit.gpgsign true  # Sign all commits
git config --global tag.gpgsign true  # Sign all tags
git config --global gpg.x509.program gitsign  # Use Gitsign for signing
git config --global gpg.format x509  # Gitsign expects x509 args

Now let’s try to commit and see what happens

git commit --allow-empty -m "SignedCommit"

A browser or a new tab opens with a sigstore authentication sigstore_authentication

If the page does not automatically open for any reason you can click on the HTTPS link displayed on the terminal.

Go to the following link in a browser:

         https://oauth2.sigstore.dev/auth/auth?access_type=online&client_id=sigstore&code_challenge=BqTyUwBAeZxXXXXXXXXXXXXXXXXXXXXXXXXXXXXXXXX&code_challenge_method=S256&nonce=2SQjOT6jSubdXXXXXXXXXXXXXXX&redirect_uri=urn%3Aietf%3Awg%3Aoauth%3A2.0%3Aoob&response_type=code&scope=openid+email&state=2SQjORRgGVwwXXXXXXXXXXXXXXX

If you have a 2 Factor authentication in place you may be prompted asking to enter a verification code in the terminal.

Go to the following link in a browser:

         https://oauth2.sigstore.dev/auth/auth?access_type=online&client_id=sigstore&code_challenge=BqTyUwBAeZxXXXXXXXXXXXXXXXXXXXXXXXXXXXXXXXX&code_challenge_method=S256&nonce=2SQjOT6jSubdXXXXXXXXXXXXXXX&redirect_uri=urn%3Aietf%3Awg%3Aoauth%3A2.0%3Aoob&response_type=code&scope=openid+email&state=2SQjORRgGVwwXXXXXXXXXXXXXXX
Enter verification code:

On login you should see a verification code on the browser sigstore_verification_code

Enter the code in the terimal to complete the authentication of your signature.

```cmd
Go to the following link in a browser:

         https://oauth2.sigstore.dev/auth/auth?access_type=online&client_id=sigstore&code_challenge=BqTyUwBAeZxXXXXXXXXXXXXXXXXXXXXXXXXXXXXXXXX&code_challenge_method=S256&nonce=2SQjOT6jSubdXXXXXXXXXXXXXXX&redirect_uri=urn%3Aietf%3Awg%3Aoauth%3A2.0%3Aoob&response_type=code&scope=openid+email&state=2SQjORRgGVwwXXXXXXXXXXXXXXX
Enter verification code: hywra4ozXXXXXXXXXXXXXX

On successfull authentication you should see this

tlog entry created with index: 27073525
[main 43633f0] SignedCommit

Verifying the commit

First verify using git verify-commit

git verify-commit HEAD

You should see details about the signature used for your last git commit.

tlog index: 27073525
gitsign: Signature made using certificate ID 0xdf16bc1599ff0480xxxxxxxxxxxxxxxxxxxxxxxx | CN=sigstore-intermediate,O=sigstore.dev
gitsign: Good signature from [{certificate-identity}]({certificate-oidc-issuer})
Validated Git signature: true
Validated Rekor entry: true
Validated Certificate claims: false
WARNING: git verify-commit does not verify cert claims. Prefer using `gitsign verify` instead.

As the message says you can also verify commit using gitsign verify. Remember the values for certificate-identity and the certificate-oidc-issuer can be found in the terminal output above.

gitsign verify --certificate-identity={certificate-identity} --certificate-oidc-issuer={certificate-oidc-issuer} HEAD

You should see the details of the signature used for your last git commit

tlog index: 27073525
gitsign: Signature made using certificate ID 0xdf16bc1599ff0480acfc3514fa8e0f738b7f1812 | CN=sigstore-intermediate,O=sigstore.dev
gitsign: Good signature from [vkumar@intelops.dev](https://github.com/login/oauth)
Validated Git signature: true
Validated Rekor entry: true
Validated Certificate claims: true

Congrats!! You have now successfully learnt how to install gitsign and how to verify commits using gitsign and git.

For the curious few, let’s push the commit to gitub and see how it shows up there:

git push origin main

Successful push looks like this

Enumerating objects: 1, done.
Counting objects: 100% (1/1), done.
Writing objects: 100% (1/1), 1.22 KiB | 1.22 MiB/s, done.
Total 1 (delta 0), reused 0 (delta 0), pack-reused 0
To github.com:VishwasSomasekhariah/end_to_end_ML_model.git
   14ee0af..43633f0  main -> main

On Github you should see a note next to your commit signaling that the commit was signed but saying ‘unverified’. That’s because there are additional steps to setup github action workflow (CI pipeline) to be able to verify signed git commits using gitsign in the github or any git platform. Once you get the pipeline setup, the step you include in the pipeline to use gitsign to verify git commits will validate the commits related signatures.

Above steps are to demonstrate how to use gitsign on a workstation.

github_signed_commit

Automate the OAuth step

If you prefer to not select the identity provider (on your browser) everytime you want to sign your commit, you can set your identity provider as git configuration in your local git settings:

git config --global gitsign.connectorID https://github.com/login/oauth 

In my case, I am using Github as identity provider to sign my commits.

Find more detail - GitSign docs .

Learn Sigstore

Alert

Alerts - Are mainly used to display details about a single topic - can be actions or just content. Cards should be relevant actionable information. For example if you want to show you companies sales in numbers you can use a card to highlight it in a better way. Mainly used on:

  • Homepages
  • Dashboards

Import

import Alert from '@intelops/intelops_ui/packages/react/components/Alert/src';

Create an Alert

<Alert 
    variant="orange"
    className="alert">
    IntelOps alert
</Alert>

Props

NameTypeDescription
idstringUnique to each element can be used to lookup an element getElementById( )
classNamestringTo add new or to override the applied styles
childrennodeComponents content
variantstringHas eight different color variants

Alert Variants

The variants in this case is that you can choose frm 8 different colors

Variants (colors)

  1. fushia
  2. slate
  3. lime
  4. red
  5. orange
  6. cyan
  7. gray
  8. darkGray

Distroless Image Creation

Getting started with Melange and Apko

This is an apk builder tool

Melange is a powerful apk builder tool that creates multi-architecture apks using declarative pipelines from a single YAML file. This makes it a valuable addition to container image factories when combined with apko.

Why Melange

Industry experts and security researchers warn that software supply chain threats are rapidly increasing, especially with the rise of automated workflows and cloud native deployments. To combat this, it’s crucial to give users the ability to verify the origin of all relevant software artifacts. With melange, you can build your application once and compose it into different architectures and distributions, just like any other image component.

This guide will teach you how to use melange to build a software package. By combining melange with apko builds, we can create a minimalist container image with the generated apk. To illustrate this powerful combination, we’ll package a small go application and walk through the steps to build the container image.

Requirements

To follow along with this guide, you will need an operating system that supports Docker and shared volumes. If you don’t have Docker installed already, you can find installation instructions for your operating system on the official Docker documentation website: https://docs.docker.com/get-docker/

You won’t need GO installed on your system, since we’ll be using Docker to build the demo app.

Linux users note

To build apks for multiple architectures using Docker, you will need to register additional QEMU headers within your kernel. Docker Desktop users have this step done automatically, so if you’re using macOS, you don’t need to worry about it. However, for other operating systems, you may need to perform this step manually.

Run the following command to register the necessary handlers within your kernel, using the multiarch/qemu-user-static image.

docker run --rm --privileged multiarch/qemu-user-static --reset -p yes

Step 1 - Download Melange image

Pull the docker image using below command

docker pull cgr.dev/chainguard/melange:latest

Above command will download the latest version of melange image. To check version of melange please run below command

docker run --rm cgr.dev/chainguard/melange version

Result of above command you can see below and find ther version melange.

  __  __   _____   _          _      _   _    ____   _____
 |  \/  | | ____| | |        / \    | \ | |  / ___| | ____|
 | |\/| | |  _|   | |       / _ \   |  \| | | |  _  |  _|
 | |  | | | |___  | |___   / ___ \  | |\  | | |_| | | |___
 |_|  |_| |_____| |_____| /_/   \_\ |_| \_|  \____| |_____|
melange

GitVersion:    v0.3.2-dirty
GitCommit:     4ed1d07ef6955379e936cf237f8dfec382454f47
GitTreeState:  dirty
BuildDate:     '1970-01-01T00:00:00Z'
GoVersion:     go1.20.3
Compiler:      gc
Platform:      linux/amd64

Step 2 - Preparing the demo go app

Use the Go example application from the below link.

git clone https://github.com/MrAzharuddin/go-backend.git

It is a simple application running on 8080 port.

go mod tidy # install the modules.
go build  # Create the binary over the code.

Step 3 - Getting started with Melange

Create a directory and run the commands in that directory only because it will keep generated files all in there.

Generate the melange keys to sign the APK files.

Generating signing keys with Melange is important for signing and verifying the authenticity of apk files. The private key is used to sign the files while the public key is used to verify the signature.

docker run --rm -v "${PWD}":/work cgr.dev/chainguard/melange keygen

Create a melange.yaml file and add the below content in that file.

package:
  name: trail
  version: v0.0.1
  epoch: 0
  description: 'the go hello world program'
  target-architecture:
    - all
  copyright:
    - paths:
        - '*'
      attestation: |
        Copyright 1992, 1995, 1996, 1997, 1998, 1999, 2000, 2001, 2002, 2005,
        2006, 2007, 2008, 2010, 2011, 2013, 2014, 2022 Free Software Foundation,
        Inc.
      license: GPL-3.0-or-later
  dependencies:
    runtime:
     - busybox
     - ca-certificates
     - git
     - wget
     - bash
     - go
environment:
  contents:
    keyring:
      - https://packages.wolfi.dev/os/wolfi-signing.rsa.pub
    repositories:
      - https://packages.wolfi.dev/os
    packages:        
      - busybox
      - ca-certificates-bundle
      - git
      - wget
      - bash
      - go
pipeline:
  - uses: git-checkout
    with:
      repository: https://github.com/MrAzharuddin/go-backend.git
      destination: build-dir
  - runs: |
      cd build-dir
      git checkout master
  - uses: go/build
    with:
      modroot: build-dir
      tags: enterprise
      packages: ./main.go
      output: backend-tutorial 
  - runs: |
      ls -al /home/build/build-dir
  1. The file defines package metadata including its name, version, description, and target architecture.
  2. It specifies copyright and licensing information for the package’s code.
  3. The file lists runtime dependencies for the package, including busybox, ca-certificates, git, wget, bash, and go.
  4. It sets up the environment by defining keyring, repository, and packages for the build process.
  5. The file specifies a pipeline of actions to be performed, including cloning a Git repository, building the Go application, and listing the contents of the build directory.

Run the file to generate the APK package.

Command:-

docker run --privileged --rm -v "${PWD}":/work cgr.dev/chainguard/melange build --debug melange.yaml --arch amd64 --signing-key melange.rsa

If you observe above command, it only generate the APK file for architecture amd64(X86_64). Instead of that we can also create APK files for multiple architectures like x86, arm6, arm7, aarch64.

After run the above command the you will find the packages directory and in it there are packages for multiple Architectures.

pradeep@pradeep-Inspiron-5567:~/Documents/apko/go/trail2-go/packages$ ll
total 12
drwxr-xr-x 2 root    root    4096 May  2 19:19 x86_64/

pradeep@pradeep-Inspiron-5567:~/Documents/apko/go/trail2-go/packages$ ls -al x86_64/
total 5812
-rw-r--r-- 1 root root     929 May  3 11:51 APKINDEX.tar.gz
-rw-r--r-- 1 root root 5935318 May  3 11:51 trail-v0.0.1-r0.apk

Here I only generate APK files only for amd64 architecture. You can find the package name trail as mentioned in the melange.yaml file. APKINDEX is used by the Alpine Linux package manager to index and track available packages in a repository for quick search and download.

Step 4 - Getting Started with Apko

Apko is a tool that allows you to build lightweight and secure Docker images using Alpine Linux as the base image. It supports a declarative YAML-based syntax that allows you to define your image in a simple and readable way. Here are the steps to install and use apko:

Installing apko and usage example

  1. Install Docker: Apko requires Docker to be installed on your system. You can download and install Docker from the official website for your operating system.
  2. Install apko: You can install apko by running the following command:
curl https://raw.githubusercontent.com/chainguard-dev/apko/main/install.sh | sh

We don’t need to install any binary in our local for now, cause we already using docker for it.

Create a apko.yaml file and add the below content.

contents:
    keyring:
       - https://packages.wolfi.dev/os/wolfi-signing.rsa.pub
    repositories:
       - https://packages.wolfi.dev/os
       - '@local /work/packages'
    packages:
      - trail@local 
accounts:
  groups:
    - groupname: nonroot
      gid: 65532
  users:
    - username: nonroot
      uid: 65532
  run-as: 65532
entrypoint:
  command: ./usr/bin/backend-tutorial

Run the apko build then it will generate the image we expecting.

Command:-

docker run --rm -v ${PWD}:/work cgr.dev/chainguard/apko build --debug --arch amd64 apko.yaml trail:v0.0.1 trail.tar -k melange.rsa.pub

Note:- We can generate the same architecture image from APK files with melange. Otherwise there will be issues like we cannot build the images as we expected.

Above command will generate the image tar ball named trail.tar. We need load the image in docker then we can find the image. Run the below command

docker load < trail.tar

pradeep@pradeep-Inspiron-5567:~/Documents/apko/go/trail2-go$ docker load < trail.tar 
c00a6b2e8f93: Loading layer [==================================================>]  213.1MB/213.1MB
Loaded image: trail:v0.0.1-amd64

We generate the image named trail:v0.0.1-amd64.

To test the application please run below commands

docker run -it --name test -p 8000:8080 trail:v0.0.1-amd64

[GIN-debug] [WARNING] Running in "debug" mode. Switch to "release" mode in production.
 - using env:	export GIN_MODE=release
 - using code:	gin.SetMode(gin.ReleaseMode)

[GIN-debug] GET    /api                      --> main.main.func1 (1 handlers)
[GIN-debug] GET    /users                    --> backend-tutorial/controllers.GetUsers (1 handlers)
[GIN-debug] GET    /user/:id                 --> backend-tutorial/controllers.GetUser (1 handlers)
[GIN-debug] PATCH  /user/:id                 --> backend-tutorial/controllers.EditUser (1 handlers)
[GIN-debug] POST   /addUser                  --> backend-tutorial/controllers.AddUser (1 handlers)
[GIN-debug] [WARNING] You trusted all proxies, this is NOT safe. We recommend you to set a value.
Please check https://pkg.go.dev/github.com/gin-gonic/gin#readme-don-t-trust-all-proxies for details.
[GIN-debug] Environment variable PORT is undefined. Using port :8080 by default
[GIN-debug] Listening and serving HTTP on :8080

Now you can access the application on localhost:8000/api

{"message":"Hello World!"}

Cleanup

Remove the docker images Melange, Apko which we use for build the application. And also remove the generated image. Remove the directory you worked on to build the image.

Reference links

Conclusion

The use of tools like wolfi, melange, and apko streamlines the process of building and packaging applications in container images, providing an efficient and secure way to deploy software in cloud-native environments. By utilizing declarative pipelines, multi-architecture apks, and attestation keys, these tools help ensure the provenance and integrity of the software artifacts, reducing the risk of security threats in the software supply chain.

Dive

Dive Tool - Container Image Exploration and Analysis

Overview

“Dive” is an open-source container image exploration and analysis tool that provides insights into the layers, contents, and changes within Docker images. It helps developers and system administrators understand the composition of images and troubleshoot issues related to image size, layer duplication, and more.

Architecture

alt text

Features

  • Visualize image layers and their sizes.
  • Compare images to identify changes and differences between layers.
  • View the contents of individual image layers.
  • Analyze image history to understand how an image is constructed.
  • Detect inefficiencies in image composition to optimize image builds.
  • Open-source and actively maintained by the community.

Getting Started

Installation

To install “dive,” follow these steps:

  1. Install Go (if not already installed) - Go Installation Guide
  2. Run the following command to install “dive”:
    go get github.com/wagoodman/dive
    

Usage

  1. Build or pull the Docker image you want to analyze.

  2. Run “dive” on the image using the following command:

dive <image_name>

Replace <image_name> with the name or ID of the Docker image.

  1. Explore the layers, contents, and changes within the image using the interactive interface.

Example Use Cases

  • Identifying redundant files or duplicated layers in images.
  • Optimizing image builds by analyzing layer sizes.
  • Troubleshooting image composition issues.
  • Understanding the impact of changes to Dockerfiles on image layers.

JSON Data Processing and Database Insertion

This repository contains a script for processing JSON data related to container images, extracting relevant information, and inserting it into a ClickHouse database. The script is designed to help store and analyze efficiency-related metrics of Docker images.

Prerequisites

  • Python 3.x installed
  • ClickHouse server accessible
  • Required Python libraries installed (see requirements.txt)

Getting Started

  1. Clone this repository or download the script files.

  2. Install the required libraries using the provided requirements.txt file.

  3. Create a .env file in the same directory as your script files with the necessary configuration.

  4. Ensure that your ClickHouse server is accessible and its connection details are configured.

Usage

  1. Run the script using the provided command.

  2. The script will read the JSON data from the specified file, process it, and insert the relevant information into the ClickHouse database.

Database Configuration

  • The script uses the connect.py file to configure the ClickHouse database connection.
  • Modify the connect.py file to provide accurate connection details to your ClickHouse server.

Data Processing and Insertion

  • The script processes JSON data to extract size-related metrics of container images.
  • It calculates efficiency scores and inserts the processed data into the ClickHouse database.

Storing following Data in a ClickHouse DB

The Python script extracts the following data from the JSON data:

  • Image name : The name of the Docker image that is being analyzed.
  • Image size (in bytes): The total size of the image, in bytes. This includes the size of all of the layers in the image, as well as the size of the image metadata.
  • Inefficient bytes (in bytes): The number of bytes in the image that are not needed. This can include unused files, empty folders, and other unnecessary data.
  • Efficiency score : A measure of how efficient the image is. The score is calculated by dividing the image size by the size of the image without the inefficient bytes. A score of 1 means that the image is perfectly efficient, while a score of 0 means that the image is completely inefficient.

Customization

  • The script can be customized to handle additional metrics or data points as needed.
  • Adjust the database schema in the script to match your data requirements.

Error Handling

  • The script contains error handling mechanisms to catch and display any exceptions that may occur during execution.
  • Errors related to JSON decoding, ClickHouse connection, and data insertion are handled.

Dive Outputs in Grafana

alt text

Conclusion

In conclusion, the “Dive” tool provides a dynamic approach to explore and understand Docker images, helping troubleshoot issues and optimize builds. On the other hand, the JSON Data Processing script offers an effective way to extract image metrics and store them in a robust database.

Both tools, “Dive” and the JSON Data Processing script, contribute to streamlined development, efficient resource utilization, and informed decision-making in containerized environments. By utilizing these tools, you empower your organization to excel in the world of containerization, fostering a culture of collaboration and innovation.

Keyless Signing an Image using CoSign

Getting started with CoSign

Why Image signing:

  • Authenticity: Verify that software artifacts haven’t been tampered with.
  • Trust and Verification: Establish trust by validating the identity of the signer.
  • Mitigating Supply Chain Attacks: Reduce the risk of compromised or malicious software.
  • Compliance and Auditing: Meet regulatory requirements and maintain accountability.
  • Non-Repudiation: Signer cannot deny association with the signed image.

Image signing enhances security, trustworthiness, and traceability in the software supply chain.

Installing Cosign:

  1. Homebrew (macOS):
brew install cosign
  1. Ubuntu and Debian:

Download the latest .deb package from the releases page and run:

sudo dpkg -i ~/Downloads/cosign_1.8.0_amd64.deb
  1. CentOS and Fedora:

Download the latest .rpm package from the releases page and install with:

rpm -ivh cosign-1.8.0.x86_64.rpm
  1. Installing Cosign via Binary:

Download the desired binary from the releases page and run:

wget "https://github.com/sigstore/cosign/releases/download/v2.0.0/cosign-linux-amd64"
sudo mv cosign-linux-amd64 /usr/local/bin/cosign
sudo chmod +x /usr/local/bin/cosign

Singing an Image using Cosign

  1. Execute the cosign sign command to digitally sign your image.
COSIGN_EXPERIMENTAL=1 cosign sign <IMAGE:TAG>

Note that there may be personally identifiable information associated with this signed artifact. This may include the email address associated with the account with which you authenticate. This information will be used for signing this artifact and will be stored in public transparency logs and cannot be removed later.

alt text

Upon obtaining the OIDC Identity Token, proceed to sign the desired image using the cosign sign command. This command, accompanied by the OIDC Identity Token, initiates the signing process. If you are operating in a non-interactive mode, Cosign will automatically generate a link that needs to be opened in a web browser to complete the signing flow.

  1. You have the flexibility to select your preferred OAuth provider for signing your image.

alt text

After completing the signing process, you will receive a success message on the browser screen.

alt text

You can verify the results of the signing process by checking the command prompt or terminal for any output or error messages after executing the signing command.

alt text

Verify the signed image

Please follow these formal steps:

Use the cosign verify command along with the signed image to initiate the verification process.

Please execute the following command to verify the image signature, ensuring that you provide the identity user and issuer information:

COSIGN_EXPERIMENTAL=1 cosign verify < IMAGE:TAG > --certificate-identity < IDENTITY USER > --certificate-oidc-issuer < ODIC ISSUER >

You will see the results like below in your command promt

alt text

Sigstore Install Cosign Cosign GitHub

Conclusion:

keyless signing with Cosign simplifies the process of signing software artifacts by associating identities with signatures instead of using traditional keys. It enhances trust and security in the software supply chain by leveraging OAuth flows and OIDC Identity Tokens. With keyless signing, users can sign images without the need for keys, making it convenient and efficient. Cosign ensures seamless integration with various identity issuers, making it a reliable choice for secure software development and distribution.

Melange-Apko

Setting up Tracetest

Getting started with tracetest

Why tracetest

Tracetest enables trace-based testing using OpenTelemetry traces, allowing you to define tests and assertions against microservices at every step of a request transaction. It offers flexibility in using your preferred trace backend, supports multiple transaction triggers, and ensures both response and underlying process correctness.

Setting up tracetest on k8s

Install Tracetest CLI on local

LINUX
curl -L https://raw.githubusercontent.com/kubeshop/tracetest/main/install-cli.sh | bash
WINDOWS
choco source add --name=kubeshop_repo --source=https://chocolatey.kubeshop.io/chocolatey ; choco install tracetest
MAC
brew install kubeshop/tracetest/tracetest

Install the Tracetest server through Tracetest CLI

On terminal run the below command after installing the tracetest cli.

tracetest server install

Then you will find 2 options to setup the tracetest server. There you need to select kubernetes installation. Please check the below result after run the above command.

How do you want to run TraceTest? [type to search]:
  Using Docker Compose
> Using Kubernetes

Install the Tracetest server through Helm

You can find the Helm chart github location in below link Github tracetest helm repo

You can install them locally on your machine with the command:

helm repo add kubeshop https://kubeshop.github.io/helm-charts
helm repo update

After that, you can install Tracetest with helm install:

helm install tracetest kubeshop/tracetest --namespace=tracetest --create-namespace

You will deployments of tracetest on tracetest namespace.

alt text

NOTE:

  • Follow the prompts and continue with all the default settings. This will deploy all resources to Kubernetes. To see exactly what is deployed, view the deployment instructions in the Deployment section of the docs.

Condensed expected output from the Tracetest CLI:

export POD_NAME=$(kubectl get pods --namespace demo -l "app.kubernetes.io/name=pokemon-api,app.kubernetes.io/instance=demo" -o jsonpath="{.items[0].metadata.name}")
export CONTAINER_PORT=$(kubectl get pod --namespace demo $POD_NAME -o jsonpath="{.spec.containers[0].ports[0].containerPort}")
echo "Visit http://127.0.0.1:8080 to use your application"
kubectl --namespace demo port-forward $POD_NAME 8080:$CONTAINER_PORT
kubectl --kubeconfig <path-to-your-home>/.kube/config --context <your-cluster-context> --namespace tracetest port-forward svc/tracetest 11633

Open your browser on http://localhost:11633.

You can now able to create tests on the UI of tracetest.

:star: Here is the UI of tracetest alt text

  • Tracetest official docs - Link
  • Github Helm Repo - Link

Conclusion

Tracetest revolutionizes testing by leveraging OpenTelemetry traces. It enables trace-based testing with assertions at every step of a request, supporting multiple transaction triggers and offering flexibility with trace back-ends. Tracetest ensures both response and underlying process correctness, making it a valuable tool for end-to-end and integration testing in distributed systems.

Exploring ORY Auth

Recent studies show that cyber attacks have been rated fifth from the top as a risk in the recent years. Did you know that there is a hacker attack every 38 seconds? Strong authentication measures can significantly reduce the risk of cyber attacks which can enhance the overall cybersecurity.


Authentication is verifying the identity of a user or entity to ensure that they are who they claim to be. It is a fundamental aspect of information security and is used to grant access to systems, resources, or data based on verified credentials. Modern authentication has become the key element in IAM security and Zero Trust security. It has multi-functional authorization method that uses proper user identity and access controls in the cloud.


Authentication Methods - which one should you choose?

There are a number of authentication methods in the market to improve security. Lets look at some of these methodsso that you can choose the ones that best fit your needs and secure our data.

  1. Passwords: One of the most used authentication methods is passwords, but they can be guessed fairly easily - attackers can use brute-force attacks, phishing scams to gain access to your accounts. None the less, passwords are a good fit for multi-factor authentication.
  2. Recovery codes: Mainly used in 2FA systems. These are generated by the authentication system during initial setup process and are basically a backup method incase you are unable to use your primary authentication method to recover your account. These are similar to pincodes but for single use.
  3. Microsoft/Google Authenticators: These are the Time-based One-Time Password (TOTP) generated by an authentication app and is valid for a short period of time. The advantage with this is that it does not need any network connection so can be used in areas with connectivity issues too, but then you need to have the device with the app near you to login.
  4. WebAuthn: Now this is a standard for passwordless authentication, mainly designed to be secure, private, easy to use and is supported by many browsers and platforms. Developers can directly use WebAuthn in their applications without the users having to install any additional software.

Authentication mechanisms

  • The regular username and password.
  • 2FA (Two-Factor Authentication)
  • Biometric Authentication
  • SSO (Single Sign-On)
  • Passwordless Authentication

It is important to protect sensitive information, to prevent unauthorized access and to ensure the privacy and security of users and their data. There are a number of authenticators in the market one of the most known being Microsoft’s authenticator app. There are other methods too and almost all of them have their own trade-offs between security, convenience and usability but then the best authentication method depends on your situation and specific security needs. One effective solution for managing authentication in modern applications is Ory - provides flexible and secure authentication framework, it can also be customized based on your business needs.

What is ORY and what does it offer?

ORY is basically an open-source project which offers a collection of tools and frameworks for identity and access management(IAM) and authentication. It offers a number of components that can be used to build and implement authentication systems. Components like:

  1. ORY Hydra - OAuth 2.0 and OpenID provider
  2. ORY Kratos - identity management server
  3. ORY Oathkeeper - identity and Access proxy
  4. ORY Keto - access contol server

ory-types

For installation you can follow: Learn Ory integration in Next.js blog in our learning center.

Conclusion

In this blog we discussed about why authentication is a critical security measure, and basic idea about what ORY is. By adding ORY you an implement many authentication mechanisms like passwords, WebAuthn and the other methods we discussed above and avoids insecure mechanisms like security questions. You can also look at SSO(Single Sign-On)authentication- which permits a user to use one set of login credentials across multiple applications. For more on SSO you can follow the blog on why you Never have to store your AWS secrets again .

Motivation for new ring buffer implementation

The BPF (Berkeley Packet Filter) subsystem in the Linux kernel offers powerful capabilities for in-kernel processing of network packets and system events. BPF programs can be used to analyze, filter, and modify data directly within the kernel. One common requirement for BPF programs is to send collected data from the kernel to user-space for post-processing, analysis, or logging.

Traditionally, BPF developers have relied on the BPF perf buffer (perfbuf) as the standard mechanism for this purpose. Perfbuf provides efficient data exchange between the kernel and user-space, but it suffers from two significant limitations: inefficient memory usage and event re-ordering. However, with the introduction of the BPF ring buffer (ringbuf) in Linux 5.8, these limitations have been overcome, offering improved memory efficiency, event ordering guarantees, and enhanced performance.

In this blog, we’ll explore the differences between the two data structures and show you how to use the new BPF ring buffer in your applications.

BPF Ring Buffer vs BPF Perf Buffer

BPF perf buffer is a collection of per-CPU circular buffers that enable efficient data exchange between kernel and user-space. However, its per-CPU design leads to two major issues:

Inefficient use of memory

Perfbuf allocates a separate buffer for each CPU, which means that BPF developers have to make a tradeoff between allocating big enough per-CPU buffers (to accommodate possible spikes of emitted data) or being memory-efficient (by not wasting unnecessary memory for mostly empty buffers in a steady state, but dropping data during data spikes). This is especially tricky for applications that have big swings between being mostly idle most of the time, but going through periodic big influx of events produced in a short period of time.

Event re-ordering**

If a BPF application has to track correlated events (e.g., process start and exit, network connection lifetime events, etc.), proper ordering of events becomes critical. However, this is problematic with BPF perf buffer since events can arrive out of order if they happen in rapid succession on different CPUs. BPF ring buffer is a multi-producer, single-consumer (MPSC) queue that can be safely shared across multiple CPUs simultaneously. It provides a familiar functionality from BPF perf buffer, including variable-length data records and efficient reading of data from user-space through memory-mapped regions. In addition, it guarantees event ordering and eliminates wasted work and extra data copying.

Memory Overhead

BPF perf buffer allocates a separate buffer for each CPU, which often means that BPF developers have to make a tradeoff between allocating big enough per-CPU buffers or being memory-efficient. Being shared across all CPUs, BPF ring buffer allows using one big common buffer to deal with this. Bigger buffer can absorb bigger spikes, but also might allow using less RAM overall compared to BPF perf buffer. BPF ring buffer memory usage also scales better with an increased amount of CPUs.

Event Ordering

BPF ring buffer solves the problem of event re-ordering by emitting events into a shared buffer and guaranteeing that if event A was submitted before event B, then it will be also consumed before event B. This often simplifies handling logic and eliminates the need for complex workarounds that are necessary with BPF perf buffer.

Wasted Work and Extra Data Copying

When using the BPF perf buffer, BPF programs must prepare the data sample and copy it into the perf buffer before sending it to user-space. This results in redundant data copying, as the data needs to be copied twice: first into a local variable or a per-CPU array (for larger samples), and then into the perf buffer itself. This approach can lead to wasted work if the perf buffer runs out of space.

In contrast, the BPF ring buffer introduces a reservation/submit API to mitigate this issue. With this approach, the BPF program can first reserve the required space within the ring buffer. If the reservation succeeds, the program can then directly use that memory to prepare the data sample. Subsequently, submitting the data to user-space becomes an efficient operation that cannot fail and does not involve any additional memory copies. By employing this reservation/submit mechanism, BPF developers can avoid unnecessary data copying and ensure that their efforts are not wasted if the buffer is full.

Performance and Applicability

Extensive synthetic benchmarking has shown that the BPF ring buffer outperforms the BPF perf buffer in almost all practical scenarios. While the BPF perf buffer theoretically supports higher data throughput due to its per-CPU buffers, this advantage becomes significant only when dealing with millions of events per second. Real-world experiments with high-throughput applications have confirmed that the BPF ring buffer is a more performant replacement for the BPF perf buffer, especially when used as a per-CPU buffer and employing manual data availability notification.

Considerations for NMI Context

It is important to note that when a BPF program needs to run from the NMI (non-maskable interrupt) context, caution is advised. BPF ring buffer employs a lightweight spin-lock internally, which means that data reservation might fail if the lock is heavily contested in the NMI context. Consequently, in situations with high CPU contention, there may be some data drops even if the ring buffer itself still has available space.

Conclusion


The introduction of the BPF ring buffer has revolutionized the way BPF programs send data from the kernel to user-space. Its superior memory efficiency, event ordering guarantees, and improved API make it a clear choice over the traditional BPF perf buffer for most use cases. The reservation/submit mechanism reduces wasted work and eliminates redundant data copying, resulting in more efficient data transfer.

With extensive benchmarking results and real-world applications confirming its superior performance

Introduction

In the context of eBPF (extended Berkeley Packet Filter), an eBPF hook refers to a specific point in the kernel or a user-space program where an eBPF program can be attached to. These hooks allow eBPF programs to execute custom code and modify the behavior of the kernel or user-space programs at specific events, such as system calls, network packets, or other kernel events. Hooks are the mechanism through which eBPF programs interact with the kernel and other programs, making them a fundamental part of eBPF’s power and flexibility.

Streaming-between-frontend-backend

In this section, we’ll discuss how you can use gRPC Streaming for your backend and front end.

Note: We are not going to look at frontend and backend parts in this excercise this is a sample demonstration of what we are going to do if we frontend and backend where we can implement gRPC streaming.

Step 1:

Setting up the Go gRPC Server

  • First, you’ll need to set up a gRPC server in Go. You can use the official Go gRPC libraries to set up the server. Once the server is set up, you can define your gRPC service and implement the streaming methods you need.

Here’s an example of a gRPC service that supports Server-Side Streaming:

syntax = "proto3";

package hello;

service HelloService {
  rpc StreamHello(HelloRequest) returns (stream HelloResponse) {}
}

message HelloRequest {
  string name = 1;
}

message HelloResponse {
  string message = 1;
}

This service defines a single method called StreamHello that takes a HelloRequest and returns a stream of HelloResponse messages.

Step 2: So next what I’m going to do is to implement the above methods in the gRPC server code. Here’s an example of how you can implement those:


func (s *server) StreamHello(req *pb.HelloRequest, stream pb.HelloService_StreamHelloServer) error {

Step 3: In this implementation, we are sending ten HelloResponse messages to the client, with a delay of 500 milliseconds between each message. You can customize the response messages and delay as per your requirements.

  for i := 1; i <= 10; i++ {
    resp := &pb.HelloResponse{
      Message: fmt.Sprintf("Hello, %s! This is message %d.", req.GetName(), i),
    }
    if err := stream.Send(resp); err != nil {
      return err
    }
    time.Sleep(500 * time.Millisecond)
  }
  return nil
}

Step 4: Setting up the Next.js Front End

Next, you’ll need to set up your Next.js front end to communicate with the gRPC server. To do this, you’ll need to use the @improbable-eng/grpc-web library, which provides gRPC Web support for JavaScript clients.

Here’s an example of how you can set up the gRPC Web client in your Next.js application:


import { HelloServiceClient } from './hello_grpc_web_pb';
import { HelloRequest } from './hello_pb';

const client = new HelloServiceClient('http://localhost:8080');

const request = new HelloRequest();
request.setName('John');

const stream = client.streamHello(request, {});

stream.on('data', response => {
  console.log(response.getMessage());
});

stream.on('end', () => {
  console.log('Streaming ended.');
});

stream.on('error', err => {
  console.error(err);
});

In this example, we are importing the HelloServiceClient and HelloRequest classes from the generated gRPC Web files. We are then creating a new client instance and a new request instance with the name “John”.

Next, we are calling the streamHello method on the client instance, which returns a stream object. We are then attaching event handlers to the stream object to handle the data, end, and error events.

Step 5: Testing the Implementation

you can test the implementation by running the gRPC server and the Next.js application. You can use the following command to start the gRPC server:

go run server.go

This will start the gRPC server on port 8080.

Next, you can run the Next.js application using the following command:

npm run dev

This will start the application on port 3000.

Once both the server and the application are running, you can open the application in your web browser and check the console output. You should see ten HelloResponse messages with a delay of 500 milliseconds between each message.

In this blog post, we discussed how you can use gRPC Streaming for a Go backend and Next.js front end. We covered how to set up a gRPC server, define a gRPC service, and implement the streaming methods in Go. We also discussed how to set up the gRPC Web client in a Next.js application and handle the stream events.

Building-server-and-client

Now we have created DB layer,let’s create a grpc.Server and start it up.

To create a gRPC server in Go for your service, you can use the grpc.NewServer() function from the google.golang.org/grpc package. Here’s an example of how you can create a server for the PersonService we defined earlier:

package main

import (
	"log"
	"net"

	"google.golang.org/grpc"

	api "my-app/api/v1"
)

func main() {
	// create a TCP listener on port 50051
	lis, err := net.Listen("tcp", ":50051")
	if err != nil {
		log.Fatalf("failed to listen: %v", err)
	}

	// create a new gRPC server instance
	server := grpc.NewServer()

	// register the PersonService with the gRPC server
	api.RegisterPersonServiceServer(server, &personServer{})

	// start the gRPC server
	if err := server.Serve(lis); err != nil {
		log.Fatalf("failed to serve: %v", err)
	}
}

In this example, we created a new grpc.Server instance using the grpc.NewServer() function. We then register our PersonService implementation with the server using the api.RegisterPersonServiceServer(server, &personServer{}) function. Here, personServer is the implementation of the PersonService interface. Finally, we start the server by calling the Serve method with the TCP listener we created earlier.

Now the task at our hands is to add RPC methods so tha server can establish connection receive gRPC requests.Here below i’m providing an example:

  • importing all the functionalities and importing your packages.
package main

import (
	"context"
	"fmt"
	"net"

	"google.golang.org/grpc"

	api "your-package-name-here/api/v1"
	"your-package-name-here/database"
)

type personServer struct {
	db *gorm.DB
}
  • Creating a person instance from the requested data
func (s *personServer) CreatePerson(ctx context.Context, req *api.CreatePersonRequest) (*api.CreatePersonResponse, error) {
	// create a new Person instance from the request data
	p := &database.Person{
		Name:  req.Name,
		Email: req.Email,
		Phone: req.Phone,
	}

	// insert the new Person into the database
	err := s.db.Create(p).Error
	if err != nil {
		return nil, status.Errorf(codes.Internal, "failed to create person: %v", err)
	}

	// create a response with the ID of the newly created Person
	res := &api.CreatePersonResponse{
		Id: uint64(p.ID),
	}

	return res, nil
}
  • Add the implementation of GetPerson and all the functionalities like delete,update and list.
func (s *personServer) GetPerson(ctx context.Context, req *api.GetPersonRequest) (*api.GetPersonResponse, error) {
	// find the Person in the database by ID
	var p database.Person
	err := s.db.First(&p, req.Id).Error
	if err != nil {
		if errors.Is(err, gorm.ErrRecordNotFound) {
			return nil, status.Errorf(codes.NotFound, "person with ID %d not found", req.Id)
		}
		return nil, status.Errorf(codes.Internal, "failed to get person: %v", err)
	}


	// create a response with the Person data
	res := &api.GetPersonResponse{
		Id:    uint64(p.ID),
		Name:  p.Name,
		Email: p.Email,
		Phone: p.Phone,
	}

	return res, nil
}

func (s *personServer) UpdatePerson(context.Context, *api.UpdatePersonRequest) (*api.UpdatePersonResponse, error) {
	return nil, status.Errorf(codes.Unimplemented, "method UpdatePerson not implemented")
}

func (s *personServer) DeletePerson(context.Context, *api.DeletePersonRequest) (*api.DeletePersonResponse, error) {
	return nil, status.Errorf(codes.Unimplemented, "method DeletePerson not implemented")
}

func (s *personServer) ListPeople(context.Context, *api.ListPeopleRequest) (*api.ListPeopleResponse, error) {
	return nil, status.Errorf(codes.Unimplemented, "method ListPeople not implemented")
}
  • This is a sample of the main function you need to implement after creating a database connection
func main() {
	// create a new database connection
	db, err := database.NewDB()
	if err != nil {
		log.Fatalf("failed to connect to database: %v", err)
	}
	defer db.Close()

	// create a new gRPC server
	s := grpc.NewServer()

	// register the PersonService server
	api.RegisterPersonServiceServer(s, &personServer{db: db})
  • Listen to TCP port
	// listen on TCP port 50051
	lis, err := net.Listen("tcp", ":50051")
	if err != nil {
		log.Fatalf("failed to listen: %v", err)
	}
  • To start the grpc server
	// start the gRPC server
	fmt.Println("listening on :50051")
	if err := s.Serve(lis); err != nil {
		log.Fatalf("failed to serve: %v", err)
	}
}

In the above xample it is a good practice to add an unimplemented method for every RPC method in your service interface. This is because gRPC will generate code for the client that calls these methods, and if you don’t provide an implementation for them, the client will not be able to communicate with the server.

let’s continue building the gRPC service implementation.

We have already implemented the CreatePerson and GetPerson methods of the PersonService interface. Now, let’s implement the ListPersons method.

The ListPersons method should return a list of all the persons in the database. Here’s one way to implement it:

func (s *personServer) ListPersons(ctx context.Context, req *api.ListPersonsRequest) (*api.ListPersonsResponse, error) {
	// query the database to get all the persons
	var persons []*database.Person
	err := s.db.Find(&persons).Error
	if err != nil {
		return nil, status.Errorf(codes.Internal, "failed to list persons: %v", err)
	}

	// create a response with the list of persons
	res := &api.ListPersonsResponse{}
	for _, p := range persons {
		res.Persons = append(res.Persons, &api.Person{
			Id:    uint64(p.ID),
			Name:  p.Name,
			Email: p.Email,
			Phone: p.Phone,
		})
	}

	return res, nil
}

Learn Jsonnet

Before taking of our journey with Jsonnet,let’s first learn about JSON format.

JSON (JavaScript Object Notation) is a lightweight data interchange format that is easy for humans to read and write and easy for machines to parse and generate. It is widely used for transmitting data between web applications and APIs. JSON is a simple key-value pair format with a basic syntax.

Jsonnet

Jsonnet is a data templating language designed to make it easier to manage and generate complex JSON data structures. It is a superset of JSON and provides additional functionality such as variables, conditionals, functions, and imports. Jsonnet allows you to write more concise and reusable code by providing a way to factor out common data and expressions into reusable components.

Now Let’s what are the differences in Jsonnet and Grafonnet

Example Usage Of Jsonnet And Grafonnet

Let’s generate JSON using Jsonnet .

.

This jsonnet code Will generate json code like below

.

As you can see jsonnet is a templating language that can generate json with logical expression make generating dynamic json more easier

On the other hand grafonnet is more specific for designing grafana dashboard it is still able to do what jsonnet do but with addition built in function to generate grafana dashboard.

.

The above code will generate new json for grafana dashboard like this

Learn Jsonnet and Grafonnet

OTEL and Signoz

Though Next.js has its own monitoring feature, it does not have end-to-end monitoring and no tracing of database calls this is when OpenTelemetry comes into the picture. Okay so we have the telemetry data but how and where do you analyze it? which is why you need Signoz.


OpenTelemetry and Signoz and how to install them?

OpenTelemetry

OpenTelemetry is a open-source project which was hosted by CNCF. It provides a standard way to generate telemetry data - data like logs, metrics, events and also traces which are all created by your applications.

merger

It might not look all that useful when you started your application as a set of microservices, but as the usage of your application increases and time comes for you to scale up, keeping track of all the microservices, their bugs and other metrics becomes difficult. For all that you need OpenTelemetry, be it logs, metrics, or just traces OpenTelemetry provides a single standard for observability, you can store, visualize and query data with the help of SDKs, APIs and othertools.

OpenTelemetry can also:

  • Provide support for both automatic and manual instrumentation.
  • Provide end-to-end implementations to genrate, collect, emit, process and export telemetry data.
  • Supports multiple context propagation formats parallelly.
  • Provides a pluggable architecture so that other formats and protocols can be added easily.

NOTE: Opentelemetry does not provide back-end observability like Jaeger or Prometheus. Also, it only supports server-side instrumentation.

Signoz

Signoz is an analysis tool for backend and it is also a full-stack open-source APM tool for all the data from OpenTelemetry. It helps in providing query and visualization capabilities for the end-user and allows you to keep track of your applications metrics and traces in one place. So, if you want to store and view metrics of the data collected by OpenTelemetry then you’ll have to install Signoz.

Signoz Installation

NOTE: Signoz is only supported in Linux and macOs machines. As of now Windows does not officially support Signoz.

Run the script below - this automatically installs Docker engine too on Linux but if you are on macOS you’ll have to install Docker seperately.

git clone -b main https://github.com/SigNoz/signoz.git
cd signoz/deploy/
./install.sh

Now that Signoz has been successfully installed on your local machine you can access it at http://localhost:3301

Before you install OpenTelemetry just run your Next.js application

Running your sample Next.js application

If you already have a next js application, uyou can run it using npm run dev if you need help with creating a Nextjs application you can refer to Next.js 101 . You should be seeing your Next.js app running on http://localhost:3000

OpenTelemetry Installation:

Step 1: Install packages

In your Next.js application install OpenTelemetry packages

npm install @opentelemetry/sdk-node
npm install @opentelemetry/auto-instrumentations-node
npm install @opentelemetry/exporter-trace-otlp-http
npm install @opentelemetry/resources
npm install @opentelemetry/semantic-conventions

Step 2: Create a tracing.js file

//reference: https://signoz.io/blog/opentelemetry-nextjs/
'use strict'

const opentelemetry = require('@opentelemetry/sdk-node');
const { getNodeAutoInstrumentations } = require('@opentelemetry/auto-instrumentations-node');
const { OTLPTraceExporter } = require('@opentelemetry/exporter-trace-otlp-http');


const { Resource } = require('@opentelemetry/resources');
const { SemanticResourceAttributes } = require('@opentelemetry/semantic-conventions');

// custom nextjs server
const { startServer } = require('./server');

// configure the SDK to export telemetry data to the console
// enable all auto-instrumentations from the meta package
const exporterOptions = {
  url: 'http://localhost:4318/v1/traces',
 }
const traceExporter = new OTLPTraceExporter(exporterOptions);
const sdk = new opentelemetry.NodeSDK({
  resource: new Resource({
    [SemanticResourceAttributes.SERVICE_NAME]: 'Nextjs-Signoz-Sample'
  }),
  traceExporter,
  instrumentations: [getNodeAutoInstrumentations()]
});

// initialize the SDK and register with the OpenTelemetry API
// it allows the API to record telemetry
sdk.start()

// gracefully shut down the SDK on process exit
process.on('SIGTERM', () => {
  sdk.shutdown()
    .then(() => console.log('Tracing terminated'))
    .catch((error) => console.log('Error terminating tracing', error))
    .finally(() => process.exit(0));
});

module.exports = sdk

Step 3: Create a server.js file : this is the file that we imported into the tracing.js file

//reference: https://signoz.io/blog/opentelemetry-nextjs/
const { createServer } = require("http")
const { parse } = require("url")
const next = require("next")

const dev = process.env.NODE_ENV !== "production"
const app = next({ dev })
const handle = app.getRequestHandler()

module.exports = {
  startServer: async function startServer() {
    return app.prepare().then(() => {
      createServer((req, res) => {
        const parsedUrl = parse(req.url, true)
        handle(req, res, parsedUrl)
      }).listen(8080, (err) => {
        if (err) throw err
        console.log("> Ready on http://localhost:8080")
      })
    })
  },
}

Step 4: To start your server now you have to add a script

To add script > Go to package.json > now add npm run start:server your package.json will look something like:

"scripts": {
    "dev": "next dev",
    "build": "next build",
    "start:server": "node tracing.js",
    "lint": "next lint"
  }

For the final step run the server

Step 5: Run the server to monitor your application

Run npm run start:server, by default your application will be available on http://localhost:8080.

NOTE: If your port is already in use make sure you use a different port number or you can also kill the port.

# Use the following commands: 
- sudo lsof -i:<portnumber>
- kill -9 <PID> where PID is your process id.

Now hit your URL a few times for dummy data and wait for your application name to be visible - you should already be seeing

signoz

Click on your applications name, here it will be Nextjs-Signoz-Sample to view the dashboard and monitor your applications metrics like latency, number of requests per second(rpc), percentage of error.

dashboard

To visualize how user requests perform across services in a multi-service application you need tracing data captured by OpenTelemetry - Go to Traces tab in Signoz

traces

Conclusion

We can see how OpenTelemetry can be used to instrument your Nextjs applications for end-to-end tracing and how you can use Signoz to keep track of the metrics collected by OpenTelemetry for the smooth performance of your application. For more detailed information you can look at the blog on Monitoring your Nextjs application using OpenTelemetry . They have a very detailed information on Signoz and OpenTelementry and multiple installation methods.

Get-to-know

what is grpc?

gRPC is an open-source high-performance Remote Procedure Call (RPC) framework developed by Google. It is designed to enable efficient communication between microservices, as well as client-server applications, and supports multiple programming languages, including Go, Java, Python, and more. gRPC uses Protocol Buffers (protobuf) as its default data serialization format. Protobuf is a language- and platform-neutral binary format that is smaller, faster, and more efficient than traditional text-based formats such as JSON and XML.

Features of gRPC:
  • Fast and efficient:gRPC uses Protocol Buffers (protobuf) as its default data serialization format, which is smaller, faster, and more efficient than traditional text-based formats such as JSON and XML. gRPC also uses HTTP/2, which enables bi-directional streaming and reduces latency and overhead.
  • Multi-language support:gRPC supports multiple programming languages, including Go, Java, Python, C++, Ruby, and more. This makes it easy for teams to use their language of choice while still communicating with services written in other languages.
  • Service definitions:gRPC uses a simple and intuitive interface definition language (IDL) to define the API of a service. This IDL is used to generate client and server code, reducing the amount of boilerplate code that developers need to write.
  • Strong typing:gRPC uses strong typing to ensure that the client and server agree on the types and structure of the data being exchanged. This helps prevent errors and makes it easier to maintain and evolve services over time.
  • Interceptors:gRPC provides interceptors that allow developers to add common functionality, such as authentication and logging, to their services without modifying the service code.
  • Load balancing:gRPC includes built-in support for load balancing, allowing for the automatic distribution of client requests across multiple servers.

Next.js 101 - Introduction and Tutorial

Next.js is a React framework are mainly used to create web applications and by framework I mean it takes care of the tooling and the configurations that are required for React. It uses Server-Side Rendering(SSR). Okay now what is this SSR? it does exactly what its name suggests “renders on the server” which means you are basically creating a HTML file with the all the website’s content and then sending it to the user. SSR enables you to load pages faster even when you internet is slow, improves search engine optimization(SEO) and so on since we are not here to learn about server-side rendering. Now back to Next.js and why to use it.


Why Next.js?

Next.js is not the only framework that React has, one of their other popular framework is Gatsby. Now, comes the question of why you need to choose Next.js over the other frameworks. Though both Gatsby and Next.js are great on their on, for now lets just say that when I looked into both of them I found that Gatsby needs additional configurations that arent required in Next.js but incase you want to properly compare both of them I recommend Next.js vs Gatsby blog.

  • Has page-based routing system (for dynamic routes).
  • Optimized pre-fetching.
  • Client-side routing.
  • Pre-rendering and allows both static generation(SSG) and server-side rendering(SSR) for each page.

To create a website you need…

  • NodeJs installed on your local system

To install Node.js you can follow instructions from node.js installation

Creating a webpage using Next.js

Like any other framework Next.js also has its own command to setup a project. There are two ways in which you can do this.

  1. The first way is to open a terminal(command prompt) and type in the below line to start your project. This will ask you to for a project name.
yarn create next-app
#or with npm:
npx create-next-app@latest

Once that is done you’ll be able to access your project by running the commands below:

cd your-project-name
yarn dev
#or
npm run dev

Now when you open the url http://localhost:3000 which will be visible on your terminal. Youl will be able to see a screen that might look something like this:

firstscreen

  1. The second way is to manually create the project. Create a directory and then install the required dependencies using npm(Node Package Manager)
mkdir your-project-name
#change directory to your project
cd your-project-name

Now add the package.json file in the root of your project directory

yarn init
#or
npm init

And finally to get started you’ll need Next, React and react-dom npm packages. To install these use the below command:

yarn add next react react-dom
#or
npm install next react react-dom

We’ll be following ‘process 1’ for now. Let us create our first pafe now

Creating your first page

To see changes in the ’localhost:3000’ webpage. You need to make changes in index.js

Go to [pages/index.js] Remove the existing code in the index.js file and try adding the code below:

import React from "react";

export default function FirstPage() {
  return (
      <div> Page 1 </div>
  );
}

If you want to create another page just add another page into the pages folder. Ok, we have 2 pages but how do you connect and navigate between them? For this Nex.js has a special tag Link tag. All you have to is

import Link from "next/link";

And then connect the two pages by adding the following code to pages/index.js

import Link from "next/link";

export default function FirstPost() {
  return (
      <h1 className="title">
        Go to<Link href="/pages/newpage">another page</Link>
      </h1>
  );
}

But in this blog we are only concentrating on a single webpage. So let us add styles to our main page(index.js) for now.

Adding styles to your pages

We already have styles folder with globals.css. We will also need CSS modules - which add CSS at the component-level locally by creating unique classNames automatically.

Create a Layout component that can be used for all the pages:

  • Create a components folder and inside it create layout.js and a CSS module called layout.module.css

In components/layout.module.css add the below code

/* reference https://nextjs.org/learn/basics/assets-metadata-css/polishing-layout */

.container {
  max-width: 36rem;
  padding: 0 1rem;
  margin: 3rem auto 6rem;
}

.header {
  display: flex;
  flex-direction: column;
  align-items: center;
}

And in components/layout.js add the below code add:

import styles from './layout.module.css';

export default function Layout({ children }) {
  return <div className={styles.container}>{children}</div>;
}
  • CSS modules are useful for component-level styles but if we want to style every page we can do that by adding styles to globals.css

Add the code below to styles/globals.css

/* reference https://nextjs.org/learn/basics/assets-metadata-css/polishing-layout */

html,
body {
  padding: 4;
  margin: 2;
  font-family: -apple-system, BlinkMacSystemFont, Segoe UI, Roboto, Oxygen, Ubuntu,
    Cantarell, Fira Sans, Droid Sans, Helvetica Neue, sans-serif;
  line-height: 1.6;
  font-size: 15px;
}

* {
  box-sizing: border-box;
}

a {
  color: #f39200;
  text-decoration: none;
}

a:hover {
  text-decoration: underline;
}

img {
  max-width: 100%;
  display: block;
}

To access the styling from globals.css you need to import them from pages/_app.js

import '../styles/global.css';

export default function App({ Component, pageProps }) {
  return <Component {...pageProps} />;
}

As we are on it already lets create one last styling files to styles text in our webpage

Create a CSS file called styles/utils.module.css


/* reference https://nextjs.org/learn/basics/assets-metadata-css/polishing-layout */

.heading2XL {
    font-size: 2.5rem;
    line-height: 1.2;
    font-weight: 800;
    letter-spacing: -0.05rem;
    margin: 1rem 0;
  }
  
  .headingXl {
    font-size: 2rem;
    line-height: 1.3;
    font-weight: 800;
    letter-spacing: -0.05rem;
    margin: 1rem 0;
  }
  
  .headingLg {
    font-size: 1.5rem;
    line-height: 1.4;
    margin: 1rem 0;
  }
  
  .headingMd {
    font-size: 1.2rem;
    line-height: 1.5;
  }
  
  .borderCircle {
    border-radius: 9999px;
  }
  
  .colorInherit {
    color: inherit;
  }
  
  .padding1px {
    padding-top: 1px;
  }
  
  .list {
    list-style: none;
    padding: 0;
    margin: 0;
  }
  
  .listItem {
    margin: 0 0 1.25rem;
  }
  
  .lightText {
    color: #9812e6;
  }

Finally update components/layout.js and index.js


import Head from "next/head";
import Image from "next/image";
import styles from "./layout.module.css";
import utilStyles from "../styles/utils.module.css";
import Link from "next/link";

const name = "Your first webpage";
export const pageTitle = "Next.js Sample Webpage";

export default function Layout({ children, page }) {
  return (
    <div className={styles.container}>
      <Head>
        <link rel="icon" href="/favicon.ico" />
        <meta name="description" content="building a webpage with next.js" />
      </Head>
      <header className={styles.header}>
        {page ? (
          <>
            <Image
              priority
              src="/images/website.jpg"
              className={utilStyles.borderCircle}
              height={160}
              width={160}
              alt=""
            />
            <h1 className={utilStyles.heading2Xl}>{name}</h1>
          </>
        ) : (
          <>
            <Link href="/">
              <Image
                priority
                src="/images/website.jpg"
                className={utilStyles.borderCircle}
                height={100}
                width={100}
                alt=""
              />
            </Link>
            <h2 className={utilStyles.headingLg}>
              <Link href="/" className={utilStyles.colorInherit}>
                {name}
              </Link>
            </h2>
          </>
        )}
      </header>
      <main>{children}</main>
    </div>
  );
}

In pages/index.js

import Head from 'next/head';
import Layout, { siteTitle } from '../components/layout';
import utilStyles from '../styles/utils.module.css';

export default function Home() {
  return (
    <Layout home>
      <Head>
        <title>{siteTitle}</title>
      </Head>
      <section className={utilStyles.headingMd}>
        <p>Your Description</p>
        <p>
          This is just a sample you can build more websites like this refer to {' '}
          <a href="https://nextjs.org/learn"> 
          Next.js tutorial {''}
          </a>for more clear and detailed explanation on why you have to add certain things.
        </p>
      </section>
    </Layout>
  );
}

You should be able to see something like this at the end of it all:

finalpage

Conclusion

In this blog, we covered how to install Next.js, creating a webpage and also styling it. To get a detailed explanation on each topic you can look into vercel’s official blog on Next.js. All I am trying to say is Next.js is a a great tool to create full-stack web applications and is easy to learn 😎, so what are you waiting for?

Getting Started with XDP in eBPF

Starting with eBPF

SysFlow Plugin for ebpf data transfer

How to build a plugin for a sysflow transfer eBPF data to your custom endpoint

sf-processor provides a performance optimized policy engine for processing, enriching, filtering SysFlow events, generating alerts, and exporting the processed data to various targets.

Please check Sysflow Processor for documentation on deployment and configuration options.

  1. Let’s clone the sf-processor repository.
git clone https://github.com/sysflow-telemetry/sf-processor.git
  1. Go to cloned repository
cd sf-processor
  1. Open the Dockerfile.
vi Docker

Add the local endpoint PORT to your Dockerfile

 EXPOSE 9091 

update loglevel=trace 4. Go to core/exporter/transports

cd core/exporter/transports

In file.go file find the Export() function. Add custom endpoint code

 resp, err := http.Post("http://localhost:8080/api", "application/json", bytes.NewBuffer(buf))
 if err != nil {
  return err
 }
  1. In order to test in your local with docker container. Open sf-processor/docker-compose.yml file and add/update below fields under the sf-processor environment:
  POLICYENGINE_MODE: enrich
  EXPORTER_TYPE: json
  EXPORTER_EXPORT: file
  EXPORTER_HOST: localhost
  EXPORTER_FILE_PATH: /processor-export/data.json # container local export data.json file path

NOTE: Need to set ECS_TYPE_INFO = "trace" In order to see the trace logs in your sf-processor

  1. Now build the docker build
cd sf-processor
make docker-build
  1. Now log in to the public docker hub account in terminal or command line(CLI)
 docker login -u username
 
  1. Now rename the build docker image and push it to the your docker hub account.
 sudo docker images
 sudo docker tag sysflowtelemetry/sf-processor:0.5.0 <docker-hub-username>/sf-processor:0.5.0
 sudo docker push <docker-hub-username>/sf-processor:0.5.0

Sysflow deployment for a custom endpoint with docker hub image local testing

sf-deployments contains deployment packages for SysFlow, including Docker, Helm, and OpenShift.

Please check Sysflow Deployments for documentation on deployment and configuration options.

  1. Let’s clone the sf-deployments repository.
git clone https://github.com/sysflow-telemetry/sf-deployments.git
  1. Go to cloned repository
cd sf-deployments
  1. Open the docker config file.
vi docker/config/.env.processor

update below fields:

 POLICYENGINE_MODE=enrich
 EXPORTER_FORMAT=json            
 EXPORTER_EXPORT=file
 EXPORTER_FILE_PATH=/processor-export/data.json
  1. Update the docker-compose.processor.yml file under the services -> sf-processer
image: <docker-hub-username>/sf-processer:0.5.0
 example: image: pyswamy/sf-processor:0.5.0

under the Volumes:

volumes:
     - socket-vol:/sock/
     - /tmp/sysflow:/processor-export/
  1. Now got to cd sf-deployment/docker/ do the deployment by running below command
 sudo docker-compose -f docker-compose.processor.yml up 

NOTE: The local api server is always up and running. https://localhost:8080/api

XDP in eBPF

Prerequisites

To develop eBPF programs, a Linux-based operating system with a kernel version of at least 3.18 is required. However, to fully utilize all available eBPF features and improvements, it is recommended to use a more recent kernel version.

To begin developing eBPF programs, you will need the following.

Software Requirements

  • Linux OS - You can have linux as a

    • Primary OS
    • Virtual Machine
    • WSL virtualization
  • Clang and LLVM - compilers

  • libbpf - ABI’s

    Provides helper functions to interact with kernel information.

  • bpftool

  • perf

Prerequisities

  • Having prior knowledge about Linux commands, system calls, and networking can greatly facilitate the development phase.
  • Basic understand of C and GO programming languages is recommended to develop eBPF programs, as eBPF programs are typically written in these languages.

How to add content to website and docs sites

Everyone needs to follow those steps. Mandatory.

Please enhance the steps if necessary, but don’t do it wrong & complex. Make it easy for everyone.

Watch the video

Setup

How to make your system ZenML Ready

ZenML comes as a Python library so it is necessary to have a python>=3.7,<= 3.10 installed on your local machine.
Virtual environments let’s you have a stable, reproducible, and portable environment. You are in control of which package versions are installed and when they are upgraded.
I use Anaconda to create and manage my Python envionments but you can also use pyenv-virtualenv or python -m venv.

  1. Let’s create a new environment called zenml_playground.
conda create --name zenml_playground python=3.8
  1. Activate the virtual environment.
conda activate zenml_playground
  1. Install ZenML inside the virtual environment.
pip install zenml
  1. [Optional] In order to get access to the ZenML dashboard locally you need to launch ZenML Server and Dashboard locally. For this, you need to install ZenML Server separately.
pip install "zenml[server]"
  1. To verify if the installation is completed start Python interpreter and try to import zenml.
import zenml
print(zenml.__version__)

If you see a ZenML version displayed on your command prompt then you are all set to explore ZenML Steps and Pipelines.

Setup workstation

Kubrnetes

Note:- Used Ubuntu as playground workstation.

  1. Master Node / Control Plane

  2. Worker Node / Minion / Data Plane

VIM Setup: Vim is a highly configurable text editor built to make creating and changing any kind of text very efficiently. It is included as “vi” with most UNIX systems and with Apple OS X. Whenever you open Vim as the current user, these settings will be used. If you ssh onto a different server, these settings will not be transferred.

expandtab: use spaces for tab

tabstop: amount of spaces used for tab

shiftwidth: amount of spaces used during indentation

validation commands: 
$hostname

$date

$more /etc/lsb-release

Note:- Install VIM package using “apt-get” package manager (for RedHat/CentOS you need to use DNF/YUM)

sudo apt-get update
sudo apt-get install -y vim

Change to Home Directory using the following command:

$cd ~

Create a file “.vimrc” inside your home directory and update with the following parameters

$vi .vimrc
set ts=2 sw=2 ai et
set cursorline cursorcolumn

Note:- Make sure the “.vimrc” file is properly updated

$cat .vimrc
set ts=2 sw=2 ai et
set cursorline cursorcolumn

Execute the following command to make the changes made in “.vimrc” reflects in the current session

$. .vimrc

child-1

Cras at dolor eget urna varius faucibus tempus in elit. Cras a dui imperdiet, tempus metus quis, pharetra turpis. Phasellus at massa sit amet ante semper fermentum sed eget lectus. Quisque id dictum magna turpis.

Etiam vestibulum risus vel arcu elementum eleifend. Cras at dolor eget urna varius faucibus tempus in elit. Cras a dui imperdiet

Etiam vestibulum risus vel arcu elementum eleifend. Cras at dolor eget urna varius faucibus tempus in elit. Cras a dui imperdiet, tempus metus quis, pharetra turpis. Phasellus at massa sit amet ante semper fermentum sed eget lectus. Quisque id dictum magna, et dapibus turpis.Etiam vestibulum risus vel arcu elementum eleifend. Cras at dolor eget urna varius faucibus tempus in elit. Cras a dui imperdiet, tempus metus quis, pharetra turpis. Phasellus at massa sit amet ante semper fermentum sed eget lectus. Quisque id dictum magna, et dapibus turpis.

child-2

Cras at dolor eget urna varius faucibus tempus in elit. Cras a dui imperdiet, tempus metus quis, pharetra turpis. Phasellus at massa sit amet ante semper fermentum sed eget lectus. Quisque id dictum magna turpis.

Etiam vestibulum risus vel arcu elementum eleifend. Cras at dolor eget urna varius faucibus tempus in elit. Cras a dui imperdiet

Etiam vestibulum risus vel arcu elementum eleifend. Cras at dolor eget urna varius faucibus tempus in elit. Cras a dui imperdiet, tempus metus quis, pharetra turpis. Phasellus at massa sit amet ante semper fermentum sed eget lectus. Quisque id dictum magna, et dapibus turpis.Etiam vestibulum risus vel arcu elementum eleifend. Cras at dolor eget urna varius faucibus tempus in elit. Cras a dui imperdiet, tempus metus quis, pharetra turpis. Phasellus at massa sit amet ante semper fermentum sed eget lectus. Quisque id dictum magna, et dapibus turpis.

child-3

Cras at dolor eget urna varius faucibus tempus in elit. Cras a dui imperdiet, tempus metus quis, pharetra turpis. Phasellus at massa sit amet ante semper fermentum sed eget lectus. Quisque id dictum magna turpis.

Etiam vestibulum risus vel arcu elementum eleifend. Cras at dolor eget urna varius faucibus tempus in elit. Cras a dui imperdiet

Etiam vestibulum risus vel arcu elementum eleifend. Cras at dolor eget urna varius faucibus tempus in elit. Cras a dui imperdiet, tempus metus quis, pharetra turpis. Phasellus at massa sit amet ante semper fermentum sed eget lectus. Quisque id dictum magna, et dapibus turpis.Etiam vestibulum risus vel arcu elementum eleifend. Cras at dolor eget urna varius faucibus tempus in elit. Cras a dui imperdiet, tempus metus quis, pharetra turpis. Phasellus at massa sit amet ante semper fermentum sed eget lectus. Quisque id dictum magna, et dapibus turpis.

Linux

Cras at dolor eget urna varius faucibus tempus in elit. Cras a dui imperdiet, tempus metus quis, pharetra turpis. Phasellus at massa sit amet ante semper fermentum sed eget lectus. Quisque id dictum magna turpis.

Etiam vestibulum risus vel arcu elementum eleifend. Cras at dolor eget urna varius faucibus tempus in elit. Cras a dui imperdiet

Etiam vestibulum risus vel arcu elementum eleifend. Cras at dolor eget urna varius faucibus tempus in elit. Cras a dui imperdiet, tempus metus quis, pharetra turpis. Phasellus at massa sit amet ante semper fermentum sed eget lectus. Quisque id dictum magna, et dapibus turpis.Etiam vestibulum risus vel arcu elementum eleifend. Cras at dolor eget urna varius faucibus tempus in elit. Cras a dui imperdiet, tempus metus quis, pharetra turpis. Phasellus at massa sit amet ante semper fermentum sed eget lectus. Quisque id dictum magna, et dapibus turpis.

Requirments

Thanks to the simplicity of Hugo, this page is as empty as this theme needs requirements.

Just download latest version of Hugo binary (> 0.60) for your OS (Windows, Linux, Mac) : it’s that simple.

image example

Reverse Proxy for Go (Using Traefik)

Introduction

Demystifying Temporal Workflows: A Hello World Example with Go Workers

Temporal offers a robust platform for building reliable distributed applications. It achieves this with a core concept: workflows. But how do these workflows function, and how do workers fit into the picture? Let’s explore this with a classic example – a “Hello World” program written in Golang that utilizes Temporal workflows and workers.

Understanding Workflows and Activities

A Temporal workflow orchestrates a sequence of tasks. Each task within a workflow is encapsulated as an activity function. These activities are independent, often performing specific actions like database access or external API calls. The workflow dictates the order of activity execution and handles any dependencies between them.

The Worker’s Role

Workers are the engines that power Temporal workflows. They are standalone processes responsible for executing both workflow and activity functions. A worker typically registers the workflow and activity definitions it can handle. When the Temporal server initiates a workflow execution, it dispatches tasks to available workers based on their registered capabilities.

Use case with a go gin server and traefik

Use Case Overview

Objective:

  • Set up a Go Gin server to serve APIs.
  • Use Traefik as a reverse proxy to manage incoming traffic.

Components:

  1. Go Gin Server: A lightweight and fast web framework for Go that will handle your blog’s backend.
  2. Traefik: A modern reverse proxy and load balancer designed to route traffic to your Go Gin server.

Why Use This Setup?

  1. Scalability: Traefik can handle multiple services and scale with your application’s needs.
  2. Dynamic Configuration: Traefik automatically updates its configuration as services start and stop.
  3. Secure Routing: Traefik can manage SSL certificates and enforce HTTPS, ensuring secure connections.
  4. Ease of Deployment: Docker simplifies the deployment process, making it easier to manage and scale your applications.

Detailed Explanation

Go Gin Server

  • Purpose: To handle HTTP requests, process them, and return the appropriate responses for your blog.
  • Benefits: High performance, easy to use, and minimalistic, making it ideal for microservices and APIs.

Traefik Reverse Proxy

  • Purpose: To act as an entry point for your web traffic, routing requests to the appropriate backend services (in this case, your Go Gin server).
  • Benefits: Automatic discovery of services, load balancing, SSL termination, and integration with Docker.

docker-compose.yaml Analysis

Let’s examine your docker-compose.yaml file to understand how these components are configured.

version: '3.7'

services:
  traefik:
    image: traefik:v2.3
    command:
      - "--api.insecure=true"
      - "--providers.docker=true"
      - "--entrypoints.web.address=:80"
      - "--entrypoints.websecure.address=:443"
      - "--certificatesresolvers.myresolver.acme.tlschallenge=true"
      - "--certificatesresolvers.myresolver.acme.email=your-email@example.com"
      - "--certificatesresolvers.myresolver.acme.storage=/letsencrypt/acme.json"
    ports:
      - "80:80"
      - "443:443"
      - "8080:8080"
    volumes:
      - "/var/run/docker.sock:/var/run/docker.sock"
      - "./letsencrypt:/letsencrypt"
    networks:
      - web

  blog:
    build:
      context: .
      dockerfile: Dockerfile
    labels:
      - "traefik.http.routers.blog.rule=Host(`yourdomain.com`)"
      - "traefik.http.routers.blog.entrypoints=web"
      - "traefik.http.routers.blog.middlewares=redirect@file"
      - "traefik.http.routers.blog-secure.rule=Host(`yourdomain.com`)"
      - "traefik.http.routers.blog-secure.entrypoints=websecure"
      - "traefik.http.routers.blog-secure.tls.certresolver=myresolver"
    networks:
      - web

networks:
  web:
    external: true

Explanation of docker-compose.yaml

  1. Version: Specifies the version of Docker Compose being used.
  2. Services:
    • traefik:
      • Image: Specifies the Traefik image to use.
      • Command: Configures Traefik with various options such as enabling the API, setting up Docker as a provider, defining entry points for HTTP and HTTPS traffic, and configuring the ACME protocol for automatic SSL certificate management.
      • Ports: Maps ports on the host to the container (80 for HTTP, 443 for HTTPS, and 8080 for the Traefik dashboard).
      • Volumes: Mounts the Docker socket and a directory for Let’s Encrypt certificates.
      • Networks: Specifies the network to which the service belongs.
    • blog:
      • Build: Specifies the context and Dockerfile for building the Go Gin server image.
      • Labels: Configures routing rules for Traefik, specifying how traffic should be directed to the blog service.
      • Networks: Specifies the network to which the service belongs.

Dockerfile Analysis

Now, let’s review your Dockerfile to understand how the Go Gin server is built.

# Start from the official Go image
FROM golang:1.16-alpine

# Set the Current Working Directory inside the container
WORKDIR /app

# Copy the go.mod and go.sum files
COPY go.mod go.sum ./

# Download all dependencies. Dependencies will be cached if the go.mod and go.sum files are not changed
RUN go mod download

# Copy the source code into the container
COPY . .

# Build the Go app
RUN go build -o main .

# Expose port 8080 to the outside world
EXPOSE 8080

# Command to run the executable
CMD ["./main"]

Explanation of Dockerfile

  1. FROM: Uses the official Go image as the base.
  2. WORKDIR: Sets the working directory inside the container to /app.
  3. COPY: Copies the go.mod and go.sum files, then downloads the dependencies.
  4. RUN: Copies the source code and builds the Go application.
  5. EXPOSE: Exposes port 8080, which is where the Go Gin server listens for requests.
  6. CMD: Specifies the command to run the Go application.

source file

Conclusion

This setup uses Traefik as a reverse proxy to handle incoming traffic, manage SSL certificates, and route requests to your Go Gin server, which serves your blog content. The docker-compose.yaml file orchestrates the services, and the Dockerfile defines how to build and run the Go Gin server. This combination provides a scalable, secure, and efficient environment for your blog.

Quickwit_Otel

Send Kubernetes logs using OTEL collector to Quickwit

Table of Contents

Prerequisites

  • A Kubernetes cluster.
  • The command line tool kubectl.
  • The command line tool Helm.
  • An access to an object storage like AWS S3.

Install Quickwit and Opentelemetry using Helm.

We will proceed with a Isolated Namespace to isolate our setup and set it as the default namespace.

kubectl create namespace qw-tutorial
kubectl config set-context --current --namespace=quickwit

Then let’s add Quickwit and Otel helm repositories:

helm repo add quickwit https://helm.quickwit.io
helm repo add open-telemetry https://open-telemetry.github.io/opentelemetry-helm-charts

You should now see the two repos in helm repos:

helm repo list
NAME                    URL
quickwit                https://helm.quickwit.io
open-telemetry          https://open-telemetry.github.io/opentelemetry-helm-charts

Now Deploying Quickwit

Here we will use basic chart configuration. Setup the AWS configure values in the local by exporting ENV variables.

export AWS_REGION=<aws region ex: us-east-1>
export AWS_ACCESS_KEY_ID=XXXX
export AWS_SECRET_ACCESS_KEY=XXXX
export DEFAULT_INDEX_ROOT_URI=s3://your-bucket/indexes

Now create the Quickwit configure file

# Create Quickwit config file.
echo "
searcher:
  replicaCount: 1
indexer:
  replicaCount: 1
metastore:
  replicaCount: 1
janitor:
  enabled: true
control_plane:
  enabled: true

environment:
  # Remove ANSI colors.
  NO_COLOR: 1

# Quickwit configuration
config:
  # No metastore configuration.
  # By default, metadata is stored on the local disk of the metastore instance.
  # Everything will be lost after a metastore restart.
  s3:
    region: ${AWS_REGION}
    access_key: ${AWS_ACCESS_KEY_ID}
    secret_key: ${AWS_SECRET_ACCESS_KEY}
  default_index_root_uri: ${DEFAULT_INDEX_ROOT_URI}

  # Indexer settings
  indexer:
    # By activating the OTEL service, Quickwit will be able
    # to receive gRPC requests from OTEL collectors.
    enable_otlp_endpoint: true
" > quickwit-values.yaml

Now run the helm install command

helm install quickwit quickwit/quickwit -f quickwit-values.yaml

You will see the pods running Quickwit services:

alt text

Let’s check Quickwit is working by port-forwarding the service:

kubectl port-forward svc/quickwit-searcher 7280

Then open your browser http://localhost:7280/ui/. You can see the list of indexes. Keep the kubectl command running and open a new terminal.

You will see the Quickwit Searcher UI like below.

alt text

Now Deploying the OTEL Collector

We need to configure the collectors in order to:

  • collect logs from k8s
  • enrich the logs with k8s attributes
  • export the logs to Quickwit indexer.

We can use the below basic values to setup the OTEL.

echo "
mode: daemonset
presets:
  logsCollection:
    enabled: true
  kubernetesAttributes:
    enabled: true
config:
  exporters:
    otlp:
      endpoint: quickwit-indexer.qw-tutorial.svc.cluster.local:7281
      # Quickwit OTEL gRPC endpoint does not support compression yet.
      compression: none
      tls:
        insecure: true
  service:
    pipelines:
      logs:
        exporters:
          - otlp
" > otel-values.yaml

Now run the below helm install command to install the OTEL.

helm install otel-collector open-telemetry/opentelemetry-collector -f otel-values.yaml

You can see logs on your indexer that show indexing has started like below.

alt text

Now we are ready to search the logs in Search UI of Quickwit.

Example of queries:

  • body.message:quickwit
  • resource_attributes.k8s.container.name:quickwit
  • resource_attributes.k8s.container.restart_count:1

alt text

alt text

Clean up

Let’s first delete the indexes and then uninstall the charts we deployed on Cluster.

# Delete the index. The command will return the list of delete split files.
curl -XDELETE http://127.0.0.1:7280/api/v1/indexes/otel-logs-v0

# Uninstall charts
helm delete otel-collector
helm delete quickwit

# Delete namespace
kubectl delete namespace quickwit

Reference Links

Quickwit

Conclusion

This guide demonstrated setting up Quickwit and OpenTelemetry for efficient Kubernetes log management. Quickwit’s user-friendly interface and powerful querying, coupled with OTEL’s log collection and export capabilities, streamline log handling and analysis.

Integrating Quickwit and OTEL enhances Kubernetes log monitoring, fostering better system observability and troubleshooting. This setup empowers informed decision-making and system optimization within Kubernetes environments.

Tekton Task Git-Clone

Tekton ClusterTask: git-clone

Description

The git-clone ClusterTask is used to clone a Git repository. It supports various parameters for customization, such as specifying the repository URL, revision, refspec, and more. This task is essential for fetching source code from a Git repository in a Tekton pipeline.

Parameters

  • url (type: string, default: “”): The URL of the Git repository to clone from.

  • revision (type: string, default: “”): The revision to checkout (branch, tag, sha, ref, etc.).

  • refspec (type: string, default: “”): The refspec to fetch before checking out the revision.

  • submodules (type: string, default: “true”): Initialize and fetch Git submodules.

  • depth (type: string, default: “0”): Perform a shallow clone, fetching only the most recent N commits.

  • sslVerify (type: string, default: “true”): Set the http.sslVerify global Git config. Setting this to false is not advised unless you are sure that you trust your Git remote.

  • crtFileName (type: string, default: “ca-bundle.crt”): The file name of the mounted certificate using the ssl-ca-directory workspace.

  • subdirectory (type: string, default: “”): Subdirectory inside the output workspace to clone the repo into.

  • sparseCheckoutDirectories (type: string, default: “”): Define the directory patterns to match or exclude when performing a sparse checkout.

  • deleteExisting (type: string, default: “true”): Clean out the contents of the destination directory if it already exists before cloning.

  • httpProxy (type: string, default: “”): HTTP proxy server for non-SSL requests.

  • httpsProxy (type: string, default: “”): HTTPS proxy server for SSL requests.

  • noProxy (type: string, default: “”): Opt out of proxying HTTP/HTTPS requests.

  • verbose (type: string, default: “true”): Log the commands that are executed during git-clone’s operation.

  • gitInitImage (type: string, default: “gcr.io/tekton-releases/github.com/tektoncd/pipeline/cmd/git-init:v0.40.2”): The image providing the git-init binary that this Task runs.

  • userHome (type: string, default: “/home/git”): Absolute path to the user’s home directory.

  • PARAM_SCM (type: string, default: “github.com”): Define the Source Code Management URL.

Workspaces

  • output: The Git repository will be cloned onto the volume backing this Workspace.

  • ssh-directory (optional): A .ssh directory with private key, known_hosts, config, etc. Copied to the user’s home before Git commands are executed. Used to authenticate with the Git remote when performing the clone. Binding a Secret to this Workspace is strongly recommended over other volume types.

  • basic-auth (optional): A Workspace containing a .gitconfig and .git-credentials file. These will be copied to the user’s home before any Git commands are run. Any other files in this Workspace are ignored. It is strongly recommended to use ssh-directory over basic-auth whenever possible and to bind a Secret to this Workspace over other volume types.

  • ssl-ca-directory (optional): A workspace containing CA certificates, which will be used by Git to verify the peer when fetching or pushing over HTTPS.

Results

  • commit: The precise commit SHA that was fetched by this Task.

  • url: The precise URL that was fetched by this Task.

  • committer-date: The epoch timestamp of the commit that was fetched by this Task.

Steps

clone

This step uses the git-init binary provided by the specified gitInitImage to perform the Git clone operation. It sets up the necessary Git configurations, handles authentication, and clones the repository.

git-sign

This step verifies the integrity of the fetched commit using Git’s signature. It checks if the commit has a Good sign (G) or an Evil sign (E). If an Evil sign is detected, it exits with a non-zero status, indicating a potential issue.

Steps

clone

This step is responsible for performing the Git clone operation. It utilizes the git-init binary provided by the specified gitInitImage. Here’s a breakdown of what it does:

  1. Setting Up Environment: It sets up the environment variables required for the clone operation. This includes parameters like URL, revision, refspec, etc.

  2. Handling Authentication:

    • If WORKSPACE_BASIC_AUTH_DIRECTORY_BOUND is set to true, it configures Git credentials using the .git-credentials file. This allows authentication with the Git remote.
    • If WORKSPACE_SSH_DIRECTORY_BOUND is set to true, it copies the .ssh directory (containing private key, known_hosts, config, etc.) to the user’s home. This is used for SSH authentication.
  3. SSL Certificate Verification:

    • If WORKSPACE_SSL_CA_DIRECTORY_BOUND is set to true, it configures Git to use CA certificates for SSL verification.
  4. Cleaning Existing Directory (if required):

    • If PARAM_DELETE_EXISTING is set to true, it clears the contents of the destination directory.
  5. Configuring Proxies (if specified):

    • It sets HTTP and HTTPS proxy servers if provided.
  6. Cloning the Repository:

    • It uses git-init to perform the clone operation. This includes parameters like URL, revision, refspec, etc.
  7. Result Handling:

    • It captures the commit SHA and committer date for later use.

This script ensures that the Git clone operation is performed with the specified parameters and configurations, allowing for a seamless integration into the Tekton pipeline.

git-sign

This step verifies the integrity of the fetched commit using Git’s signature. It checks if the commit has a Good sign (G) or an Evil sign (E). If an Evil sign is detected, it exits with a non-zero status, indicating a potential issue.

#!/bin/sh

ls -al
cat /etc/os-release
apk update --no-cache && apk add git gpg gpgsm --no-cache
git config --global --add safe.directory /workspace/output
if git log --format="%G?" -n 1 "$(params.revision)" | grep -vq "N"; then
    echo "The commit has a Good sign (G)."
else
    echo "The commit has an Evil sign (E)."
    exit 1
fi

Terraform Security Check using tfsec

Exploring Terraform Security with tfsec

Terraform has become an essential tool for managing cloud infrastructure as code, but ensuring the security of your Terraform configurations is equally crucial. This is where tfsec comes into play. tfsec is a powerful static analysis tool designed specifically for Terraform code. In this blog post, we’ll delve into what tfsec is, why it’s important, and how you can leverage it to enhance the security of your Terraform deployments.

What is tfsec?

tfsec is a lightweight yet robust security scanner for Terraform. It analyzes your Terraform code to identify potential security vulnerabilities, misconfigurations, and adherence to best practices. The tool is designed to catch issues early in the development process, helping you build more secure infrastructure from the ground up.

Key Features

1. Security Scanning

One of tfsec’s primary functions is to scan your Terraform code for security vulnerabilities. It examines your configurations for potential risks that could lead to security breaches or compliance violations.

2. Best Practice Checks

In addition to security checks, tfsec provides recommendations for adhering to best practices in Terraform development. This includes suggestions on code structure, naming conventions, and resource configurations.

3. Comprehensive Ruleset

tfsec comes with an extensive set of predefined rules covering multiple cloud providers, including AWS, Azure, Google Cloud Platform, and more. This ensures that you can apply security checks and best practices across a wide range of environments.

4. Custom Rule Support

You have the flexibility to define custom rules in tfsec to enforce specific policies or requirements unique to your organization or project. This allows you to tailor the tool to your specific needs.

5. Easy Integration

tfsec can be seamlessly integrated into your CI/CD pipelines, providing automated security checks as part of your deployment process. This helps catch issues early and ensures that only secure configurations are deployed.

Getting Started with tfsec

Using tfsec is straightforward. Begin by installing the tool, which is available for various platforms including Linux, macOS, and Windows. Once installed, simply run tfsec against your Terraform codebase, and it will provide a detailed report highlighting any identified issues.

tfsec .

You can observe the output as follows: alt text

Conclusion

tfsec is a valuable addition to any Terraform developer’s toolkit. By incorporating static analysis into your development workflow, you can identify and address potential security risks early in the process, reducing the likelihood of security incidents in your infrastructure.

Remember, while tfsec is a powerful tool, it’s just one component of a comprehensive security strategy. It should be used in conjunction with other best practices, such as regular security audits, thorough testing, and continuous monitoring.

To get started with tfsec, visit the official GitHub repository at https://github.com/aquasecurity/tfsec and start enhancing the security of your Terraform deployments today.


Note: Always ensure you have the latest version of tfsec and refer to the official documentation for the most up-to-date information and best practices.

Package Management in Git Platform

Package Registry Authentication is basically the process of verifying the users identity or any applications that are trying to access packages in the registry. What are these package registries? Package registries are centralized repositories - they store and distribute software packages, libraries and dependencies. If you want to add certain controls or security over who can perform what actions in the registry then authentication is the best way to do it.


GitHub package registry authentication

For github’s package registry authentication - Personal Access Tokens(PAT) can be used. In github PATs are mainly used to access its features and services. Usually PATs are alternatives to directly using passwords as they offer more control over what actions can be performed by the token holder.

Why so we need GitHub PATs?

  • Access Control: Ensures that only authorized users can access or use a specific package in the registry.
  • Rate Limiting: Allows the registry to track usage and apply appropriate rate limits to each authentication user or application.
  • Enhanced Security: PATs can be modified to specific permissions, limiting the actions that can be prformed using the token. This means that you will be able to generate tokens with all the necessary permissions which reduces the risk of unauthorized access.
  • Token Expiration: Unlike passwords, you can set an expiration date for the access tokens - so even if a token gets compromised it’ll only be valid for a limited period of time.
  • Revocation and Management: If any time you wnt to revoke the access for a specific application or a service you can just delete the PAT associated to it without affecting your main GitHub account.
  • Fine-Grained Control: GitHub also allows you to configure the scope of each PAT i.e you can create tokens with read-only access, write access or any other specific access.

Adding GitHub Personal Access Token to VSCode

To authenticate yourself using Gitub PAT in VScode:

  1. Generate a Personal Access Token (PAT)
  • Login in to your GitHub account:

Go to Settings > Developer Settings(in the sidebar) > Personal access tokens

  • Click on “Generate a new token”.
  • Provide the token description and select the necessary scope/ permissions for the package registry access - read, write, delete packages or so on and click on generate token.

It may look something like this:

merger

  1. Store the Personal Access Token

Once your token is generated, make sure to copy it immediately, as you won’t be able to see it again. Store it securely.

  1. Authenticate with the Package Manager

Depending on your programming language and the package manager, you need to configure it to use the generated PAT for authentication. So if you are using npm for JavaScript packages, you can set the token using:

npm login --registry=https://npm.pkg.github.com --scope=@USERNAME

How to installed a published package in code:

  1. Create a .npmrc file inside the root directory of your repo.
  2. Add your
registry= add link here
auth_token= (PAT created using the private github account)
  1. Close and re-launch VSCode for the changes to take effect.

Conclusion

In this blog, we looked at why we need Personal Access Tokens and how you can add them into your VSCode. If you would like to see an example for this on further steps to access a private repository you can look at Install Intelops-UI package to your Code blog .

Avatar

Avatar - can be used to display people or objects, its basically like a profile photo. Usually we see avatars in:

  • User Profile pages

Import

import Avatar from '@intelops/intelops_ui/packages/react/components/Avatar/src';

Create an Avatar

<Avatar
    src="https://avatars.githubusercontent.com/u/91454231?s=280&v=4"
    alt="intelops logo"
    variant="circle"
    className="avatar"
    size="medium">
    Avatar Name
</Avatar>

Props

NameTypeDescription
idstringUnique to each element can be used to lookup an element getElementById( )
classNamestringTo add new or to override the applied styles
childrennodeComponents content
variantstringThe shape in which your avatar appears - square or circle
srcstringThe URL of the image that needs to be displayed
altstringThe alternate text in case the image fails to load
sizestringTo alter your avatar sizes, from xsmall to xlarge

Variant Types (Available button types)

Avatars come in different shapes and sizes.

Size Variants

2 avatar variants:

  • circle
  • square
Avatar Sizes

5 size options:

  • xsmall
  • small
  • medium
  • large
  • xlarge

CoSign

Ory integration in Next.js

To secure your Next.js application with Ory authentication - basically adding a login page so that only authorized users can view your page or to atleast know who your users are. To get started all you need is a Next.js application. So, lets jump right in:

Creating a Next.js application

If you don’t already have a Next.js application, you can create one with the help of Next.js 101 - Introduction and Tutorial blog .

Step 1: Installing Ory

Once you have your application ready. Install Ory’s SDK - to make API calls to Ory and Ory’s integration tools for JavaScript frameworks. Ory provides all the integration tools that you’ll need to combine Ory with Next.js

1.1: Install Ory SDK

//This step is the same for both TypeScript and JavaScript appication.
npm i --save @ory/integrations @ory/client

1.2: Create [...paths].js in pages/api/.ory/

Add this in […paths].js to connect your Next.js application with Ory’s APIs. This also ensures that all credentials and cookies are set up properly.

//reference: https://www.ory.sh/docs/getting-started/integrate-auth/nextjs
// @ory/integrations offers a package for integrating with Next.js in development which is not required in production.
import { config, createApiHandler } from "@ory/integrations/next-edge"

export { config }

// We need to create the Ory Network API which acts like a bridge.
export default createApiHandler({
  fallbackToPlayground: true,
  dontUseTldForCookieDomain: true
})

Step 2: Add sign in to access your homepage

This is to add session check to your Next.js application homepage. Add the code snippets to your existing code in index.js

—Code snippets that you need to : #1, #2, #3

Code #1: Below existing import statements

// import Router and configurations
import { useEffect, useState } from "react"
import { useRouter } from "next/router"
import { Configuration, FrontendApi } from "@ory/client"
import { edgeConfig } from "@ory/integrations/next"

const ory = new FrontendApi(new Configuration(edgeConfig))

// Returns either the email or the username depending on the user's Identity Schema
const getUserName = identity =>
  identity.traits.email || identity.traits.username

Code #2: Inside export{} statement

  // To access router, session and URL objects inside function
  const router = useRouter()
  const [session, setSession] = useState()
  const [logoutUrl, setLogoutUrl] = useState()

  useEffect(() => {
    ory
      .toSession()
      .then(({ data }) => {
        // User has a session!
        setSession(data)
        // Create a logout URL
        ory.createBrowserLogoutFlow().then(({ data }) => {
          setLogoutUrl(data.logout_url)
        })
      })
      .catch(() => {
        // Redirect to login page
        return router.push(edgeConfig.basePath + "/ui/login")
      })
  }, [router])

  if (!session) {
    return null
  }

Code #3: Inside return statement

// Get user identity - it can be username or emailID
   <p>Hello, {getUserName(session?.identity)}</p>
   <a href={logoutUrl}>Log out</a>

If you followed the Next.js 101 blog you can directly add the complete code block to your index.js

Complete code

//Reference for ORY code: https://www.ory.sh/docs/getting-started/integrate-auth/nextjs
import Head from 'next/head';
import Layout, { siteTitle } from '../components/layout';
import utilStyles from '../styles/utils.module.css';

// Added Code #1 start
import { useEffect, useState } from "react"
import { useRouter } from "next/router"

import { Configuration, FrontendApi } from "@ory/client"
import { edgeConfig } from "@ory/integrations/next"

const ory = new FrontendApi(new Configuration(edgeConfig))

// Returns either the email or the username depending on the user's Identity Schema
const getUserName = identity =>
  identity.traits.email || identity.traits.username
// Added Code #1 end

export default function Home() {

  // Added Code #2 start
  const router = useRouter()
  const [session, setSession] = useState()
  const [logoutUrl, setLogoutUrl] = useState()

  useEffect(() => {
    ory
      .toSession()
      .then(({ data }) => {
        // User has a session!
        setSession(data)
        // Create a logout url
        ory.createBrowserLogoutFlow().then(({ data }) => {
          setLogoutUrl(data.logout_url)
        })
      })
      .catch(() => {
        // Redirect to login page
        return router.push(edgeConfig.basePath + "/ui/login")
      })
  }, [router])

  if (!session) {
    // Still loading
    return null
  }
  // Added Code #2 end

  return (
    <Layout home>
                   {/* Added Code #3 start*/}
                   <p>Hello, {getUserName(session?.identity)}</p>
                   <a href={logoutUrl}>Log out</a>
                   {/* Added Code #3 end*/}
              <Head>
        <title>{siteTitle}</title>
      </Head>
      <section className={utilStyles.headingMd}>
        <p>Your Webpage</p>
        <p>
          This is just a sample you can build more websites like this refer to {' '}
          <a href="https://nextjs.org/learn"> 
          Next.js tutorial {''}
          </a>for more clear and detailed explanation on why you have to add certain things.
        </p>
      </section>
    </Layout>
  );
}

Run your application

Start server

npm run dev

Now open the default browser which is almost always http://localhost:3000, you’ll be seeing Ory’s Sign in page.

NOTE: Here, we are using a javascript application, if your application is in typescript you’ll have to make some changes in the ory code that you added. For typescript code you can follow the official ORY documentation

Tracetesting using ci/cd tool - Tekton

Setting up tekton pipelines on k8s

To install Tekton Pipelines on a Kubernetes cluster:

  1. Run one of the following commands depending on which version of Tekton Pipelines you want to install:
  • Latest official release:
kubectl apply --filename https://storage.googleapis.com/tekton-releases/pipeline/latest/release.yaml
  • Specific release:
kubectl apply --filename https://storage.googleapis.com/tekton-releases/pipeline/previous/<version_number>/release.yaml

Replace <version_number> with the numbered version you want to install. For example, v0.28.2

  1. Monitor the installation:
kubectl get pods --namespace tekton-pipelines --watch

When all components show 1/1 under the READY column, the installation is complete. Hit Ctrl + C to stop monitoring.

After you can see the complete resource by running below command.

kubectl get all -n tekton-pipelines

The result looks like atl text

Before starting trace testing, you need to setup the tracetest server on kubernetes.

For the tracetest server installation please follow the setting up tracetest document from intelops website learning center .

Creating Docker image for Tracetest CLI

In our Tekton task for Tracetest, we will create a custom Docker image that includes the Tracetest CLI, which we have installed beforehand.

You have the flexibility to either use the provided Dockerfile to set up your own Tracetest CLI image or utilize Intelops’ pre-built Tracetest image within your Tekton task.

Dockerfile

FROM cgr.dev/chainguard/wolfi-base as build

RUN apk update && apk add curl bash
RUN curl -L https://raw.githubusercontent.com/kubeshop/tracetest/main/install-cli.sh | bash
RUN chmod 755 /tmp/tracetest

FROM cgr.dev/chainguard/wolfi-base

COPY --from=build /tmp/tracetest /usr/bin/tracetest 

ENTRYPOINT ["/bin/bash -l"]

Getting started with Tracetest

  1. We need Microservice with OTEL instrumented.
  2. Deploy the Microservice in K8s.
  3. Check the traces in data source like Grafana tempo or Jaeger.
  4. Define your tracetest definition file to test the microservice.

Here is an example definition file test.yaml which I deployed my NodeJS app into K8s.

type: Test
spec:
  name: otempo-post-req
  description: post req test
  trigger:
    type: http
    httpRequest:
      url: http://otempo-service.default.svc.cluster.local:8080/items
      method: POST
      headers:
      - key: Content-Type
        value: application/json
      body: |2-
         {
        "name": "user-name",
        "description": "to test the NodeJS app",
        "price": 98
        }
  specs:
    - selector: span[name = "POST /items"]
      assertions:
        - attr:tracetest.span.duration <= 500ms
        - attr:http.status_code = 201
  outputs:
  - name: USER_TEST_ID
    selector: span[name = "work testing post"]
    value: attr:tracetest.response.body | json_path '$.id'
  1. Save your definition file in git repo.
  2. Use the below tekton task to test you Micoservice.
apiVersion: tekton.dev/v1beta1
kind: ClusterTask
metadata:
  name: tracetest
spec:
  params:
    - name: file-name
      type: string        
  workspaces:
    - name: source      
  steps:
  - name: tracetest
    image: pradeepgoru/tracetest:latest
    workingDir: $(workspaces.source.path)
    script: |
       sleep 20
       pwd
       ls -al
       tracetest configure --endpoint http://tracetest.tracetest.svc.cluster.local:11633 --analytics=false
       tracetest test run --definition $(params.file-name) --verbose -w       
  1. We need a pipeline configured with git-clone and tracetest task. Here is my pipeline
apiVersion: tekton.dev/v1beta1
kind: Pipeline
metadata:
  name: tracetest
spec:
  params:
  - name: repo-url
    type: string 
    description: The git repo URL to clone from.
  - name: file-name
    type: string
    description: The definition file
  workspaces:
  - name: shared-data
    description: |
      This workspace contains the cloned repo files, so they can be read by the
      next task.      
  - name: git-credentials
    description: basic-auth
  tasks:
  - name: fetch-source
    taskRef:
      name: git-clone
      kind: ClusterTask
    workspaces:
    - name: output
      workspace: shared-data
    - name: basic-auth
      workspace: git-credentials
    params:
    - name: url
      value: $(params.repo-url)
  - name: tracetest
    taskRef:
      name: tracetest
      kind: ClusterTask
    runAfter:
      - fetch-source
    workspaces:
    - name: source
      workspace: shared-data
    params:
    - name: file-name
      value: $(params.file-name)
  1. Provide the necessary configurations to git-clone and then add the tracetest task in the pipeline.

  2. Now we need configure a PipelineRun to trigger the pipeline.

Here is an example pipelinerun

apiVersion: tekton.dev/v1beta1
kind: PipelineRun
metadata:
  name: tracetest-run
spec:
  pipelineRef:
    name: tracetest
  podTemplate:
    securityContext:
      fsGroup: 65532
  workspaces:
  - name: shared-data
    volumeClaimTemplate:
      spec:
        accessModes:
        - ReadWriteOnce
        resources:
          requests:
            storage: 2Gi
  - name: git-credentials
    secret:
      secretName: basic-auth
  params:
    - name: repo-url
      value: https://gitlab.com/intelops/definitions-files.git
    - name: file-name
      value: test.yaml

After run the pipeline you will find the tekton taskruns and pipelinerun succeeded and jobs in completed state.

alt text alt text alt text

The logs of tracetest task be like

alt text

Tekton Docs - Link Instrumentation - Link Tracetest Definition - Link Tracetest Github Examples - Link

Authentication and Authorization using ORY

APIs of BPF Ring Buffer

The BPF ring buffer (ringbuf) introduces a new and powerful mechanism for efficient data exchange between the Linux kernel and user-space. As a part of the BPF subsystem, the ring buffer provides a flexible and performant solution for transferring data collected by BPF programs. In this blog post, we will explore the semantics and APIs of the BPF ring buffer and understand why it is a significant improvement over other alternatives.

Semantics of the BPF Ring Buffer

The BPF ring buffer is presented to BPF programs as an instance of the BPF map of type BPF_MAP_TYPE_RINGBUF. This design choice offers several advantages over alternative approaches. Initially, the idea of representing an array of ring buffers, similar to BPF_MAP_TYPE_PERF_EVENT_ARRAY, was considered. However, this approach would limit the flexibility of looking up ring buffers using arbitrary keys. To address this concern, the BPF_MAP_TYPE_HASH_OF_MAPS was introduced. This alternative provides the ability to implement various topologies, from a single shared ring buffer for all CPUs to complex applications with hashed or sharded ring buffers.

Another alternative considered was introducing a new concept of a generic “container” object alongside BPF maps. However, this approach would require significant additional infrastructure for observability and verifier support without providing any substantial benefits over using a map. By leveraging the existing BPF map infrastructure, the BPF ring buffer remains familiar to developers, integrates seamlessly with tooling like bpftool, and simplifies the BPF program development process.

Key and value sizes in the BPF ring buffer are enforced to be zero, while the max_entries parameter specifies the size of the ring buffer, which must be a power of 2.

APIs for BPF Ring Buffer

The BPF ring buffer provides two sets of APIs to BPF programs for efficient data transfer.

  1. bpf_ringbuf_output()

The bpf_ringbuf_output() function allows copying data from one place to the ring buffer, similar to bpf_perf_event_output(). While this API incurs an extra memory copy, it is useful when the record size is not known to the verifier beforehand. Additionally, its similarity to bpf_perf_event_output() simplifies the migration process from using perf buffers to the BPF ring buffer.

  1. bpf_ringbuf_reserve(), bpf_ringbuf_commit(), bpf_ringbuf_discard()

The reservation and commit APIs split the data transfer process into two steps, providing more control and efficient memory usage.

bpf_ringbuf_reserve() reserves a fixed amount of space in the ring buffer. If successful, it returns a pointer to the reserved memory within the ring buffer. BPF programs can then use this pointer similarly to accessing data inside array or hash maps. Unlike bpf_ringbuf_output(), this API avoids the need for extra memory copies, especially when dealing with records larger than the BPF stack space allows. However, it restricts the reserved memory size to a known constant size that the verifier can verify.

Once the BPF program has prepared the data within the reserved memory, it can either bpf_ringbuf_commit() the record or bpf_ringbuf_discard() it. The commit operation marks the record as ready for consumption by the user-space consumer, while the discard operation indicates that the record should be ignored. Discard is useful for advanced use cases, such as ensuring atomic multi-record submissions or emulating temporary memory allocation within a single BPF program invocation.

Querying Ring Buffer Properties and Fine-Grained Control

In addition to the reservation and commit APIs, the BPF ring buffer provides a helper function called bpf_ringbuf_query() that allows querying various properties of the ring buffer. Currently, four properties are supported:

1. BPF_RB_AVAIL_DATA This property returns the amount of unconsumed data currently present in the ring buffer. It provides valuable insights into the data availability and can be used for monitoring and debugging purposes.

2. BPF_RB_RING_SIZE The BPF_RB_RING_SIZE property returns the size of the ring buffer. Knowing the size is essential for efficiently managing data transfer and ensuring optimal performance.

3. BPF_RB_CONS_POS and BPF_RB_PROD_POS These properties return the current logical position of the consumer and producer, respectively. They provide a snapshot of the ring buffer’s state at the moment of querying. However, it’s important to note that these values might change by the time the helper function returns, as the ring buffer’s state is highly changeable. Therefore, these properties are primarily useful for debugging, reporting, or implementing heuristics that consider the dynamic nature of the ring buffer.

One such heuristic involves fine-grained control over poll/epoll notifications regarding new data availability in the ring buffer. By using the BPF_RB_NO_WAKEUPand BPF_RB_FORCE_WAKEUP flags in conjunction with the output/commit/discard helpers, BPF programs gain a high degree of control over notifications. This fine-grained control enables more efficient batched notifications and allows for optimized data consumption. It’s important to note that the default self-balancing strategy of the BPF ring buffer is usually sufficient for most applications, providing reliable and efficient performance out of the box.

Conclusion


The BPF ring buffer introduces a powerful mechanism for efficient data transfer between the Linux kernel and user-space. With its flexible semantics and well-designed APIs, it outperforms other alternatives and provides developers with a high-performance solution for data exchange. The split reservation/commit process and the ability to query ring buffer properties offer fine-grained control and efficient memory usage. By leveraging the BPF map infrastructure and integrating with existing tooling, the BPF ring buffer simplifies development and ensures compatibility with the broader BPF ecosystem. Whether you’re working on real-time analytics, monitoring, or any other data-intensive application, the BPF ring buffer is a valuable tool for achieving optimal performance and scalability in your BPF programs.

Hooks

  1. Tracepoint

    Tracepoints are predefined events in the kernel that allow you to trace the flow of control in the kernel. Tracepoints are inserted at specific points in the kernel code and can be used to record function calls, function returns, and other events.

  2. RawTracepoint

    Raw tracepoints are similar to tracepoints, but they allow you to define your own events in the kernel. Raw tracepoints can be used to trace specific events in the kernel that are not covered by the predefined tracepoints.

  3. Kprobe

    Kprobes allow you to trace function calls in the kernel. Kprobes are inserted at specific points in the kernel code and can be used to record arguments, return values, and other information about the function call.

  4. kretprobe

    Kretprobes are similar to kprobes, but they are used to trace function returns in the kernel. Kretprobes can be used to record return values and other information about the function return.

  5. Uprobe

    Uprobes allow you to trace function calls in user space applications. Uprobes are inserted at specific points in the application code and can be used to record arguments, return values, and other information about the function call.

  6. Uretprobe

    Uretprobes are similar to uprobes, but they are used to trace function returns in user space applications. Uretprobes can be used to record return values and other information about the function return.

  7. Fentry

    Fentry hooks are used to trace function calls in the kernel. Fentry hooks are inserted at the beginning of a function and can be used to record arguments, return values, and other information about the function call.

  8. Cgroups

    Cgroups hooks allow you to attach eBPF programs to control groups (cgroups) in the kernel. Cgroups hooks can be used to monitor the resource usage of processes in the cgroup.

  9. XDP

    XDP (eXpress Data Path) hooks are used to process network packets as soon as they arrive in the network stack, before any other processing takes place. XDP hooks can be used to filter, modify, or drop packets, and can be used to implement fast packet processing in the kernel.

Get-to-know-grpcurl

grpcurl is a command-line tool that can be used to interact with gRPC servers. Here are some examples of how to use grpcurl to make gRPC requests by hand:

  • List available services -
grpcurl -plaintext localhost:50051 list

This will output a list of available gRPC services.

  • List available methods - To list the available methods for a particular service, you can run the following command:
grpcurl -plaintext localhost:50051 list api.PersonService

This will output a list of available methods for the PersonService gRPC service.

  • Make a unary RPC call - To make a unary RPC call to a gRPC server, you can run the following command:
grpcurl -plaintext -d '{"name": "Alice", "email": "alice@example.com", "phone": "555-1234"}' localhost:50051 api.PersonService/CreatePerson

This will create a new person with the given name, email, and phone number.

  • Make a server-side streaming RPC call - To make a server-side streaming RPC call to a gRPC server, you can run the following command:
grpcurl -plaintext -d '{"id": 1}' localhost:50051 api.PersonService/GetPerson

This will retrieve the person with the given ID, and will stream the person’s data back to the client.

These are just a few examples of how to use grpcurl to make gRPC requests by hand. The tool is quite flexible and can be used to make a wide variety of gRPC requests like REST calls.

implementing a gRPC service involves more than just writing the code to handle RPC methods. You’ll also need to consider how to handle errors, handle authentication and authorization, and perform testing and debugging.

gRPC-Web-Streaming

gRPC Web Streaming is a way of using gRPC communication over HTTP/1.1 or HTTP/2, rather than using gRPC over a binary protocol like TCP. This enables gRPC to be used in web browsers, which do not support binary protocols. However, since HTTP/1.1 and HTTP/2 do not support bidirectional streaming, gRPC Web Streaming does not support bidirectional streaming, which is a feature of gRPC. As a result, gRPC Web Streaming only supports Server-Side Streaming and Client Streaming, but not Bidirectional Streaming.

gRPC Web Streaming supports two types of streaming:

  • Server-Side Streaming: In Server-Side Streaming, the client sends a single request message to the server, and the server responds with a stream of messages, similar to traditional Server-Side Streaming in gRPC.

  • Client-Side Streaming: In Client-Side Streaming, the client sends a stream of request messages to the server, and the server responds with a single response message, similar to traditional Client-Side Streaming in gRPC.

gRPC Web Streaming provides many benifits, including improved performance, reduced network latency, and increased flexibility. By using HTTP/1.1 pr HTTP/2, gRPC Web Streaming enables gRPC to be used in web browsers and web applications. This allows client-side web applications to communicate with server side applications using gRPC, providing a consistent and efiicient way of communication across the entire application stack.

Additionally , gRPC Web Streaming reduces the amount of network traffic and improves application performance by enabling the client and server to exchange only the necessary data, rather than sending large data sets all at once. Thus is especially important in web applications where network latency can have a significant impact on application performance.

Error-Handling

In this blog we are going to talk about error handling while streaming between frontend and backend.

Here’s an example of how you can handle errors on both server-side and client side.

func (s *server) StreamHello(req *pb.HelloRequest, stream pb.HelloService_StreamHelloServer) error {
  for i := 1; i <= 10; i++ {
    resp := &pb.HelloResponse{
      Message: fmt.Sprintf("Hello, %s! This is message %d.", req.GetName(), i),
    }
    if err := stream.Send(resp); err != nil {
      log.Printf("Error sending message: %v", err)
      return err
    }
    time.Sleep(500 * time.Millisecond)
  }
  return nil
}

In this updated implementation, we are handling errors that may occur during the streaming process. If an error occurs while sending a message, we log the error and return it to the client.

On the client-side, you can handle the error using the stream.on(’error’,…) event.

Here’s an example:


stream.on('error', err => {
  console.error('Error:', err);
});

In this example, we are logging the error to the console.

By handling errors on both the server-side and client-side, you can ensure that your application is robust and handles errors gracefully.

Protocol-Buffers

Protocol Buffers are a core part of gRPC and are used to define the service interfaces and the messages that are exchanged between the client and server.

In gRPC, you define your service using Protocol Buffers in a .proto file, which specifies the methods that the service exposes and the types of messages that are exchanged. The .proto file is then compiled using the Protocol Buffers compiler to generate the code that can be used to implement the service and the client.

When a client makes a request to a gRPC server, it sends a Protocol Buffers-encoded message that contains the data required for the request. The server receives the message and uses the generated code to deserialize the message and extract the relevant data.

Similarly, when the server sends a response back to the client, it encodes the response data as a Protocol Buffers message and sends it to the client. The client then deserializes the message and extracts the response data.

That’s enough defining protocol buffers,so let’s do some practical demonstration:

First thing to do is to create a message type:

syntax = "proto3";
package api.v1;

message Person {
  string name = 1;
  int32 age = 2;
  repeated string hobbies = 3;
}

In this example, we define a message type called Person. The message has three fields: name, age, and hobbies. This is just a simple example of how to create a message type using proto3 syntax. In practice, message types can be much more complex and can include nested messages, enums, and other types of fields.

Then let’s install the protobuf compiler:

$ brew install protobuf

make sure it’s installed using the following command:

$ protoc --version

Now install proto-gen-go

$ brew install grpc 
$ go install google.golang.org/protobuf/cmd/protoc-gen-go@v1.26

and then add it to your path in env variables:

export PATH="$PATH:$(go env GOPATH)/bin"

Note:This command works only on MacOS but if your OS is Windows,then you have to go to env variables and add it manually

Create a .proto file with the Person message type: you can use the example I provided earlier.

Compile the .proto file: run the following command to generate the Go code:

protoc --go_out=paths=source_relative:. person.proto

This command tells the Protocol Buffers compiler to generate Go code from the person.proto file and output it to the current directory (–go_out=.). The paths=source_relative option tells the compiler to generate the output files using relative paths.

Check the generated Go code: you should see a person.pb.go file in the api/v1 directory. This file contains the Go struct for the Person message type. Here is what the generated code should look like:

// Code generated by protoc-gen-go. DO NOT EDIT.
// versions:
// 	protoc-gen-go v1.27.1
// 	protoc        v3.17.3
// source: person.proto

package v1

import (
	fmt "fmt"
	proto "github.com/golang/protobuf/proto"
)
...

type Person struct {
	Name    string   `protobuf:"bytes,1,opt,name=name,proto3" json:"name,omitempty"`
	Age     int32    `protobuf:"varint,2,opt,name=age,proto3" json:"age,omitempty"`
	Hobbies []string `protobuf:"bytes,3,rep,name=hobbies,proto3" json:"hobbies,omitempty"`
}

Now that we have things working for one message type,let’s define service:

syntax = "proto3";

package api.v1;

message Person {
  string name = 1;
  int32 age = 2;
  repeated string hobbies = 3;
}

service PersonService {
  rpc GetPerson(GetPersonRequest) returns (Person) {}
  rpc AddPerson(AddPersonRequest) returns (AddPersonResponse) {}
}

message GetPersonRequest {
  string name = 1;
}

message AddPersonRequest {
  Person person = 1;
}

message AddPersonResponse {
  string message = 1;
}

Now let’s generate generate the client and the service code using protoc again.

protoc --go_out=. --go-grpc_out=. person.proto

This command generates two Go files:

  • person.pb.go: contains the generated code for the Person message type.
  • person_grpc.pb.go: contains the generated code for the PersonService gRPC service interface.

The –go_out option generates Go code for the protocol buffers and the –go-grpc_out option generates the Go code for the gRPC service.

Now that all the required code is generated, it’s time for me to build the server-side will be continued in the next blog….

Grafonnet-Components

Grafonnet:

Grafonnet is a domain-specific language (DSL) for generating Grafana dashboards and panels. Grafana is an open-source data visualization and monitoring tool that allows users to create interactive and customizable dashboards for analyzing and displaying data from various sources. Grafonnet is based on the Jsonnet language and provides a set of high-level abstractions and functions for generating Grafana dashboards and panels. It allows users to define reusable components and templates that can be used across multiple dashboards, making it easier to maintain consistency and standardization across multiple Grafana instances. Using Grafonnet, users can define dashboards, panels, queries, alerts, and annotations in a concise and modular way, and then compile the definitions into JSON format that can be consumed by Grafana. The language also supports advanced features such as conditionals, loops, and functions, allowing users to build complex and dynamic dashboards.

components of Grafonnet:

Grafonnet provides a number of pre-built components and libraries that can be used to create custom Grafana dashboards quickly and easily. Some of the key components of Grafonnet include:

  • Panels: Panels are the basic building blocks of a Grafana dashboard. Grafonnet provides a range of pre-built panel components that can be used to display data in a variety of formats, including tables, graphs, gauges, and more.

  • Layouts: Layouts are used to organize panels within a dashboard. Grafonnet provides a number of flexible and customizable layout components that can be used to create responsive and dynamic dashboards that adapt to changing data and user requirements.

  • Data sources: Data sources are used to connect to external data sources, such as databases, APIs, and other data services. Grafonnet provides a range of data source components that can be used to connect to a variety of data sources and retrieve data for display in a dashboard.

  • Visualizations: Grafonnet includes a number of pre-built Visualizations

Under the hood in Grafonnet:
  +---------------------------------+
  | Define JSON data structure using |
  | Grafonnet functions and operators|
  +---------------------------------+
                |
                v
  +---------------------------------+
  |Compile JSON data structure to    |
  |Grafana dashboard using the       |
  |jsonnet tool                      |
  +---------------------------------+
                |
                v
  +---------------------------------+
  |Import the compiled Grafana       |
  |dashboard into Grafana            |
  +---------------------------------+
                |
                v
  +---------------------------------+
  |Grafana renders the dashboard as  |
  |a web page, displaying the data   |
  |and visualizations defined in the |
  |JSON data structure                |
  +---------------------------------+
                |
                v
  +---------------------------------+
  |Users interact with the dashboard,|
  |changing the time range, filters, |
  |and other options                 |
  +---------------------------------+
                |
                v
  +---------------------------------+
  |Modify the JSON data structure to |
  |customize the dashboard           |
  +---------------------------------+
                |
                v
  +---------------------------------+
  |Recompile the JSON data structure,|
  |and update the dashboard          |
  +---------------------------------+
Key benifits of Jsonnet:

The key benefit of using Jsonnet as the underlying language for Grafonnet is that it provides a powerful templating system that allows you to generate dynamic configurations based on variables, conditions, and other programmatic constructs. This makes it possible to define reusable components and templates that can be easily shared and combined to create complex dashboards.

Learn eBPF

Linux Networking With eBPF

Socket Programming Essentials in C

“Socket Programming Essentials in C” is your ultimate guide to gaining the foundational knowledge necessary for proficient network programming. In this blog, we delve into the intricacies of socket programming, exploring key concepts, techniques, and tools essential for building robust network applications using the C programming language

sock_common

The struct sock_common structure represents a common structure used for socket connections in the Linux kernel. Let’s go through the fields and understand their meanings:

 struct sock_common {
	/* skc_daddr and skc_rcv_saddr must be grouped on a 8 bytes aligned
	 * address on 64bit arches : cf INET_MATCH() and INET_TW_MATCH()
	 */
	union {
		__addrpair	skc_addrpair;
		struct {
			__be32	skc_daddr;
			__be32	skc_rcv_saddr;
		};
	};
	union  {
		unsigned int	skc_hash;
		__u16		skc_u16hashes[2];
	};
	/* skc_dport && skc_num must be grouped as well */
	union {
		__portpair	skc_portpair;
		struct {
			__be16	skc_dport;
			__u16	skc_num;
		};
	};
	unsigned short		skc_family;
	volatile unsigned char	skc_state;
	unsigned char		skc_reuse:4;
	unsigned char		skc_reuseport:4;
	int			skc_bound_dev_if;
	union {
		struct hlist_node	skc_bind_node;
		struct hlist_nulls_node skc_portaddr_node;
	};

1.skc_addrpair (union) It represents the source and destination IP addresses as a pair. The structure contains two fields: skc_daddr and skc_rcv_saddr, both of type __be32 (big-endian 32-bit value).

  • skc_daddr represents the destination IP address.
  • skc_rcv_saddr represents the source IP address of the received packet.

2. skc_hash (union)

  • It is used for hash calculations and contains a single field, skc_hash.
  • skc_hash is an unsigned integer used for storing the calculated hash value.

3. skc_portpair (union)

It represents the source and destination port numbers as a pair.

  • The structure contains two fields: skc_dport and skc_num.
  • skc_dport represents the destination port number.
  • skc_num is an unsigned 16-bit value used for various purposes.

4. skc_family

  • It represents the address family of the socket connection.
  • The address family is typically indicated by predefined constants such as AF_INET (IPv4) or AF_INET6 (IPv6).

5. skc_state

  • It indicates the state of the socket connection.
  • The meaning of the different values depends on the specific socket type (e.g, TCP or UDP).

6. skc_reuse and skc_reuseport

  • These fields are used for socket reuse and port reuse functionality, respectively.
  • They store 4-bit values that control the behavior of socket and port reuse.

7. skc_bound_dev_if

  • It represents the index of the network device to which the socket is bound.
  • It identifies the specific network interface associated with the socket.

8. skc_bind_node and skc_portaddr_node (unions)

  • These unions represent different types of linked list nodes used by the kernel for managing socket bindings and port addresses.
  • Each field in the struct sock_common structure plays a specific role in storing and managing socket connection information, including IP addresses, port numbers, address family, socket state, reuse options, and network device binding.

sockaddr_in and in_addr

The structures struct sockaddr_in and struct in_addr are used for handling internet addresses in networking applications. Here are the details of these structures:

1. struct sockaddr_in

  • This structure is defined in <netinet/in.h>.
  • It represents an IPv4 socket address.
  • The structure has the following fields:
    • sin_family: A short integer representing the address family, such as AF_INET. sin_port: An unsigned short integer representing the port number. It is typically converted to network byte order using the htons() function.
    • sin_addr: A structure of type struct in_addr that represents the IP address. It contains the field s_addr, an unsigned long integer representing the IP address in network byte order.
    • sin_zero: An array of 8 characters used for padding. It is typically set to all zeros. This field is often ignored.

2. struct in_addr

  • This structure is defined in <netinet/in.h>.
  • It represents an IPv4 address.
  • The structure has a single field:
    • s_addr: An unsigned long integer representing the IP address in network byte order.
    • The inet_aton() function is commonly used to load an IP address into this field.

These structures are used in networking programming to work with IPv4 addresses and socket addresses. They provide a standardized format for representing IP addresses and port numbers. The struct sockaddr_in structure is often used as an argument for socket-related system calls, while struct in_addr is used for storing IP addresses independently.

Socket Programming For Getting Connection info in eBPF

The get_connection_info function in the eBPF program is responsible for extracting relevant information from the struct sock_common object and populating the corresponding data structures (struct sockaddr_in or struct sockaddr_in6) based on the address family (conn->skc_family) and event type (event).

static __always_inline int get_connection_info(struct sock_common *conn, struct sockaddr_in *sockv4, struct sockaddr_in6 *sockv6, sys_context_t *context, args_t *args, u32 event)
{
    switch (conn->skc_family)
    {
    case AF_INET:
        sockv4->sin_family = conn->skc_family;//Sets the address family 
        sockv4->sin_addr.s_addr = conn->skc_daddr;//Copies the destination IP address
        sockv4->sin_port = (event == _TCP_CONNECT) ? conn->skc_dport : (conn->skc_num >> 8) | (conn->skc_num << 8);//
        args->args[1] = (unsigned long)sockv4;
        context->event_id = (event == _TCP_CONNECT) ? _TCP_CONNECT : _TCP_ACCEPT;
        break;

    case AF_INET6:
        sockv6->sin6_family = conn->skc_family;
        sockv6->sin6_port = (event == _TCP_CONNECT) ? conn->skc_dport : (conn->skc_num >> 8) | (conn->skc_num << 8);
        bpf_probe_read(&sockv6->sin6_addr.in6_u.u6_addr16, sizeof(sockv6->sin6_addr.in6_u.u6_addr16), conn->skc_v6_daddr.in6_u.u6_addr16);
        args->args[1] = (unsigned long)sockv6;
        context->event_id = (event == _TCP_CONNECT) ? _TCP_CONNECT_v6 : _TCP_ACCEPT_v6;
        break;

    default:
        return 1;
    }

    return 0;
}
  1. Here’s a breakdown of the get_connection_info function:

The function takes several parameters: conn (a pointer to struct sock_common), sockv4 (a pointer to struct sockaddr_in), sockv6 (a pointer to struct sockaddr_in6), context (a pointer to sys_context_t), args (a pointer to args_t), and event (an unsigned 32-bit integer representing the event type).

  1. The function begins with a switch statement based on the skc_family field of conn.

3.1. In the case AF_INET branch, which corresponds to IPv4 addresses:

sockv4->sin_family = conn->skc_family;
  • The sin_family field of sockv4 is set to conn->skc_family, indicating the address family as AF_INET.
sockv4->sin_addr.s_addr = conn->skc_daddr;
  • The sin_addr.s_addr field of sockv4 is assigned the value of conn->skc_daddr, which represents the destination IP address.
sockv4->sin_port = (event == _TCP_CONNECT) ? conn->skc_dport : (conn->skc_num >> 8) | (conn->skc_num << 8);

The sin_port field of sockv4 is set based on the ternary expression (event == _TCP_CONNECT) ? conn->skc_dport : (conn->skc_num >> 8) | (conn->skc_num << 8). If event is equal to _TCP_CONNECT, it assigns conn->skc_dport to sockv4->sin_port. Otherwise, it swaps the byte order of conn->skc_num and assigns the result as the port number. This ensures the correct representation of the port number in network byte order (big endian).

args->args[1] = (unsigned long)sockv4;
  • The second argument of args is set to the unsigned long value of sockv4, allowing passing the sockv4 structure to user-space.
context->event_id = (event == _TCP_CONNECT) ? _TCP_CONNECT : _TCP_ACCEPT;
  • The event_id field of context is set to _TCP_CONNECT if event is equal to _TCP_CONNECT, otherwise, it is set to _TCP_ACCEPT.

3.2. In the case AF_INET6 branch, which corresponds to IPv6 addresses:

sockv6->sin6_family = conn->skc_family;
  • The sin6_family field of sockv6 is set to conn->skc_family, indicating the address family as AF_INET6.
sockv6->sin6_port = (event == _TCP_CONNECT) ? conn->skc_dport : (conn->skc_num >> 8) | (conn->skc_num << 8);
  • The sin6_port field of sockv6 is set in a similar manner as in the IPv4 case, based on the ternary expression (event == _TCP_CONNECT) ? conn->skc_dport : (conn->skc_num >> 8) | (conn->skc_num << 8).
bpf_probe_read(&sockv6->sin6_addr.in6_u.u6_addr16, sizeof(sockv6->sin6_addr.in6_u.u6_addr16), conn->skc_v6_daddr.in6_u.u6_addr16);
  • The IPv6 address is read from conn->skc_v6_daddr.in6_u.u6_addr16 using bpf_probe_read and stored in the sin6_addr.in6_u.u6_addr16 field of sockv6. This ensures that the IPv6 address is safely accessed and copied to user-space.
args->args[1] = (unsigned long)sockv6;
  • The second argument of args is set to the unsigned long value of sockv6, allowing passing the sockv6 structure to user-space.
context->event_id = (event == _TCP_CONNECT) ? _TCP_CONNECT_v6 : _TCP_ACCEPT_v6;
  • The event_id field of context is set to _TCP_CONNECT_v6 if event is equal to _TCP_CONNECT, otherwise, it is set to _TCP_ACCEPT_v6.

Installation Guide

The following commands can be used on any Debian-based Linux operating system. Below is the guide on ubuntu 22.04.

Ubuntu 22.04

Use this command to update local package collection database.

sudo apt update

Go

sudo apt install golang

Clang and LLVM

sudo apt install clang llvm

libbpf

sudo apt install libelf-dev

bpftool and perf

sudo apt install linux-tools-$(uname -r)

ZenML and Its Components

What is ZenML?

It is a cloud and tool-agnostic open-source MLOPS framework that can be used to create a portable, production ready MLOps pipelines. It consists of following core components that you would need to know to get started.

  1. Steps
  2. Pipelines
  3. Stack
  4. Stack Components

What is a ZenML Step?

Step is an atomic components of a ZenML Pipeline. Each Step is well defined to take some input, apply some logic on it and give an output. An example of a simple step could be as follows:

from zenml.steps import step, Output

@step
def step_one() -> Output(output_a=int, output_b=int):
 """This Step returns a predefined values for a and b"""
 return 5, 12

Let’s define another step that takes two values as input and returns a sum as output.

from zenml.steps import step, Output

@step
def step_two(input_a: int, input_b: int) -> Output(output_sum=int):
 """Step that add the inputs and returns a sum"""
 return input_a + input_b

Note:
You can run a step function by itself by calling .entrypoint() method with the same input parameters. For example:

step_two.entrypoint(input_a = 6, input_b = 10)

What is a ZenML Pipeline?

A Pipeline consists of a series of Steps, organized in any order as per your usecase. It is used to simply route the outputs through the steps. For example:

from zenml.pipelines import pipeline

@pipeline
def pipeline_one(step_1, 
   step_2 ):
    output_a, output_b = step_one()
    output_sum = step_two(output_a, output_b)

After you define your pipeline you can instantiate and run your pipeline by calling:

pipeline_one(step_1 = step_one(), step_2 = step_two()).run()

You should see an output similar to this in your command line:

Creating run for pipeline: `pipeline_one`
Cache disabled for pipeline `pipeline_one`
Using stack `default` to run pipeline `pipeline_one`
Step `step_one` has started.
Step `step_one` has finished in 0.010s.
Step `step_two` has started.
Step `step_two` has finished in 0.012s.
Pipeline run `pipeline_one-20_Feb_23-13_11_20_456832` has finished in 0.152s.

You can learn more about pipelines here .

What is a ZenML Stack?

A stack is a set of configurations for your infrastructure on how to run your pipeline. For example if you want to run your pipeline locally or on a cloud. ZenML uses a default stack that runs your pipeline and stores the artifacts locally, if nothing is defined by the user.

What are the Components of a Stack?

A Stack Component is responsible for one specific task of an ML workflow. Consists mainly of two main groups:

  1. Orchestrator, responsible for the execution of the steps within the pipeline.
  2. Artifact Store, responsible for storing the artifacts generated by the pipeline.

Remember, for any of the stack components you need to first register the stack component to the respective component group and then set the registered stack as active to use it in the current run. For example if you want to use an S3 bucket as your artifact storage, then you need to first register the S3 bucket with the artifact-store with a stack name and then set the stack name as active. You can learn more about how to do this from here .

Installation

The following steps are here to help you initialize your new website. If you don’t know Hugo at all, we strongly suggest you learn more about it by following this great documentation for beginners .

Cypress, Jest, Selenium, Appium

Create your project

Hugo provides a new command to create a new website.738

hugo new site <new_project>

Install the theme

Install the GoDocs theme by following this documentation

This theme’s repository is: https://github.com/themefisher/godocs.git

Alternatively, you can download the theme as .zip file and extract it in the themes directory

Or you can check this video documentation for installing this template:

Basic configuration

When building the website, you can set a theme by using --theme option. However, we suggest you modify the configuration file (config.toml) and set the theme as the default.

# Change the default theme to be use when building the site with Hugo
theme = "godocs"

Create your first content pages

Then, create content pages inside the previously created chapter. Here are two ways to create content in the chapter:

hugo new installation/first-content.md
hugo new installation/second-content/_index.md

Feel free to edit thoses files by adding some sample content and replacing the title value in the beginning of the files.

Launching the website locally

Launch by using the following command:

hugo serve

Go to http://localhost:1313

Build the website

When your site is ready to deploy, run the following command:

hugo

A public folder will be generated, containing all static content and assets for your website. It can now be deployed on any web server.

Info

This website can be automatically published and hosted with Netlify (Read more about Automated HUGO deployments with Netlify ). Alternatively, you can use Github pages

Mac OS

Cras at dolor eget urna varius faucibus tempus in elit. Cras a dui imperdiet, tempus metus quis, pharetra turpis. Phasellus at massa sit amet ante semper fermentum sed eget lectus. Quisque id dictum magna turpis.

Etiam vestibulum risus vel arcu elementum eleifend. Cras at dolor eget urna varius faucibus tempus in elit. Cras a dui imperdiet

Etiam vestibulum risus vel arcu elementum eleifend. Cras at dolor eget urna varius faucibus tempus in elit. Cras a dui imperdiet, tempus metus quis, pharetra turpis. Phasellus at massa sit amet ante semper fermentum sed eget lectus. Quisque id dictum magna, et dapibus turpis.Etiam vestibulum risus vel arcu elementum eleifend. Cras at dolor eget urna varius faucibus tempus in elit. Cras a dui imperdiet, tempus metus quis, pharetra turpis. Phasellus at massa sit amet ante semper fermentum sed eget lectus. Quisque id dictum magna, et dapibus turpis.

Building Packet Counters With BPF Maps and XDP

The program is designed to be attached to an XDP (eXpress Data Path) hook, which is a high-performance data path in the Linux kernel for fast packet processing.

The goal of this program is to count the number of packets that pass through the XDP hook and store the statistics in a BPF hash map.

Use Case of Temporal with Traefik and Go

Test your use case with a go gin server and traefik

How to Test the gin server and traefik in local environment

  • You can test the gin server and traefik in local environment using the following command:
    # Go to root directory
    docker compose up -d
    
    # once the containers are up and running you will see the following output
    ✔ Container traefik-poc-mongodb-1                        Started 0.6s 
    ✔ Container traefik                                      Started 0.5s 
    ✔ Container traefik-poc-go-gin-1                         Started 0.5s
    

container status

  • To check the status of your traefik, you can click on the traefik link in the browser. https://localhost:8080 browser-view

  • To check the status of your gin server, you can click on the gin server link in the browser. https://localhost:9000 Image

Test your use case with a go gin server, temporal and traefik

How to Test the gin server and traefik in local environment

  • You can test the gin server which contains temporal worker and traefik in local environment using the following command:

    # Go to root directory
    docker compose up -d
    
    # once the containers are up and running you will see the following output
      ✔ Container traefik-temporal-poc-traefik-1                             Running 0.0s
      ✔ Container traefik-temporal-poc-temporal-1                            Started 0.4s
      ✔ Container traefik-temporal-poc-worker-1                              Started 0.5s
      ✔ Container traefik-temporal-poc-server-1                              Started 0.7s
    

    container status

  • To check the status of your traefik, you can click on the traefik link in the browser. https://localhost:8080 browser-view

  • Check the temporal dashboard in the browser. http://localhost:8233/namespaces/default/workflows temporal-dashboard

  • Check the temporal metrics on http://localhost:41393/metrics temporal-metrics

  • Make a post request to run workflows in temporal.

    curl -H 'Content-Type: application/json' -d '{ "name" : "test intelops" }' -X POST http://localhost:7200/start-workflow
    

    success-http

  • The post request will create a new workflow in temporal. You can see the dashboard with the new workflow in the temporal dashboard. http://localhost:8233/namespaces/default/workflows temporal-dashboard-running

  • This workflow will be executed till the worker completes its activity or task. Once it’s done, the workflow will be marked as completed. workflow-completed

  • We can also see the overview/history of the workflow in the temporal dashboard. http://localhost:8233/namespaces/default/workflows temporal-metrics

Workflow with Temporal

Understanding Temporal’s workflows with a Hello World Example

Components Overview

  1. Worker: The worker listens for tasks and executes the workflow and activities.
  2. Starter: The starter initiates the workflow.
  3. Workflow and Activities: These define the actual tasks to be performed.

The Worker

The worker is responsible for executing the workflows and activities registered with it. Here’s a closer look at the worker implementation:

package worker

import (
    "log"
    temporallearnings "temporal-learnings"

    "go.temporal.io/sdk/client"
    "go.temporal.io/sdk/worker"
)

func HelloWorker() {
    c, err := client.Dial(client.Options{})
    if err != nil {
        log.Fatalln("Unable to create client", err)
    }
    defer c.Close()

    w := worker.New(c, "hello-world", worker.Options{})

    w.RegisterWorkflow(temporallearnings.Workflow)
    w.RegisterActivity(temporallearnings.Activity)

    err = w.Run(worker.InterruptCh())
    if err != nil {
        log.Fatalln("Unable to start worker", err)
    }
}

Explanation:

  1. Client Connection: Establishes a connection to the Temporal server.
  2. Worker Creation: Creates a new worker that listens to the “hello-world” task queue.
  3. Register Workflow and Activity: Registers the workflow and activity functions defined in the temporallearnings package.
  4. Run Worker: Starts the worker to listen for tasks until interrupted.

The Starter

The starter is responsible for initiating the workflow execution. Here’s how it’s done:

package main

import (
    "context"
    "log"
    temporallearnings "temporal-learnings"

    "go.temporal.io/sdk/client"
)

func main() {
    c, err := client.Dial(client.Options{})
    if err != nil {
        log.Fatalln("Unable to create client", err)
    }
    defer c.Close()

    workflowOpts := client.StartWorkflowOptions{
        ID:    "hello-world_workflow_id",
        TaskQueue: "hello-world",
    }

    workflowExec, err := c.ExecuteWorkflow(context.Background(), workflowOpts, temporallearnings.Workflow, "TemporalLearning")
    if err != nil {
        log.Fatalln("Unable to execute workflow", err)
    }

    log.Println("Started workflow", workflowExec.GetID(), "with runID", workflowExec.GetRunID())

    var result string
    err = workflowExec.Get(context.Background(), &result)
    if err != nil {
        log.Fatalln("Unable to get workflow result", err)
    }
    log.Println("Workflow result: ", result)
}

Explanation:

  1. Client Connection: Establishes a connection to the Temporal server.
  2. Workflow Options: Defines options for starting the workflow, such as the workflow ID and the task queue name.
  3. Execute Workflow: Starts the workflow execution, passing “TemporalLearning” as an input parameter to the workflow function.
  4. Get Result: Waits for the workflow to complete and retrieves the result.

The Workflow and Activities

The workflow and activities define the tasks that will be executed. Here’s the implementation:

package temporallearnings

import (
    "context"
    "time"

    "go.temporal.io/sdk/activity"
    "go.temporal.io/sdk/workflow"
)

func Workflow(ctx workflow.Context, name string) (string, error) {
    actOpts := workflow.ActivityOptions{
        StartToCloseTimeout: 10 * time.Second,
    }

    ctx = workflow.WithActivityOptions(ctx, actOpts)

    logger := workflow.GetLogger(ctx)
    logger.Info("TemporalLearning Workflow started, name: " + name)

    var result string
    err := workflow.ExecuteActivity(ctx, Activity, name).Get(ctx, &result)
    if err != nil {
        logger.Error("Activity failed.", "Error", err)
        return "", err
    }
    logger.Info("TemporalLearning Workflow completed, result: " + result)
    return result, nil
}

func Activity(ctx context.Context, name string) (string, error) {
    logger := activity.GetLogger(ctx)
    logger.Info("TemporalLearning Activity started, name: " + name)

    time.Sleep(5 * time.Second)
    return name + " Activity completed", nil
}

Explanation:

  1. Workflow Function: This is the main function that orchestrates the workflow. It configures activity options and executes the activity.
    • Activity Options: Sets a timeout for the activity.
    • Logger: Logs the start and completion of the workflow.
    • Execute Activity: Runs the activity and waits for its result.
  2. Activity Function: This defines the task to be performed.
    • Logger: Logs the start of the activity.
    • Sleep: Simulates a task by sleeping for 5 seconds.
    • Return Result: Returns a completion message.

Putting It All Together

  1. Start the Worker: Run the worker to start listening for tasks.
    go run worker.go
    
  2. Start the Workflow: Run the starter to initiate the workflow.
    go run starter.go
    

The worker will pick up the task from the task queue, execute the workflow and its associated activities, and return the result. The starter will log the workflow result once the workflow execution is complete.

Source code

Conclusion

This simple “Hello World” example demonstrates the basic structure of a Temporal application, including worker setup, workflow initiation, and task execution. Temporal’s powerful features allow developers to build robust and scalable applications with ease.

Tekton Task Sonar Scan

Tekton ClusterTask: SonarQube Scanner

Description

The sonarscan ClusterTask facilitates static code analysis using SonarQube, provided a SonarQube server is hosted. SonarQube is a powerful tool for continuous inspection of code quality and security, supporting over 25 popular programming languages. It detects bugs, vulnerabilities, and code smells across project branches and pull requests.

Parameters

  • SONAR_SCANNER_IMAGE: The SonarQube scanner CLI image for performing the scan. Default: docker.io/sonarsource/sonar-scanner-cli:4.6@sha256:7a976330a8bad1beca6584c1c118e946e7a25fdc5b664d5c0a869a6577d81b4f

  • SONAR_COVERAGE_TRH: Default threshold value of SonarQube code scan to pass. Default: 80.00

  • SONAR-EXIT-CODE: Exit code to determine task success or failure. Default: 0

Workspaces

  • source: Workspace containing the code to be scanned by SonarQube.

  • sonar-settings (optional): Optional workspace where SonarQube properties can be mounted.

  • sonar-token (optional): Sonar login required to send the scan results to SonarCloud.

Steps

sonar-scan

This step uses the SonarQube scanner CLI image specified in SONAR_SCANNER_IMAGE. It performs the following operations:

#!/usr/bin/env bash
pwd
export SONAR_TOKEN=`cat /workspace/sonar-token/SONAR_TOKEN`
echo $SONAR_TOKEN
cp /workspace/sonar-settings/sonar-project.properties .
ls -al
cat sonar-project.properties
sonar-scanner
apk update && apk add curl jq

Extracting Sonar Host URL and Project Key

The script extracts the Sonar host URL and project key from sonar-project.properties:

# Extract sonar.host.url
export line=$(grep "sonar.host.url" "sonar-project.properties")
export SONAR_HOST=$(echo "$line" | cut -d'=' -f2)
export SONAR_HOST=$(echo "$SONAR_HOST" | tr -d ' ')
echo "Sonar Host URL: $SONAR_HOST"

# Extract sonar.projectKey
export line=$(grep "sonar.projectKey" "sonar-project.properties")
export SONAR_PROJ=$(echo "$line" | cut -d'=' -f2)
export SONAR_PROJ=$(echo "$SONAR_PROJ" | tr-d ' ')
echo "Sonar Project Key: $SONAR_PROJ"

This code segment retrieves the Sonar host URL and project key, crucial for the subsequent steps in the SonarQube scanning process.

Retrieving Code Coverage

The following code retrieves the code coverage percentage from the SonarQube server:

# Retrieve SONAR_COVERAGE using curl and jq
export SONAR_COVERAGE=$(curl "$SONAR_HOST/api/measures/component?metricKeys=coverage&componentKey=$SONAR_PROJ" | jq -r ".component.measures[] | .value")
if [ -n "$SONAR_COVERAGE" ]; then
    echo "Threshold code coverage is $(params.SONAR_COVERAGE_TRH)"
    echo "Actual code coverage is $SONAR_COVERAGE" 
    wait       
    comparison_result=$(echo "$(params.SONAR_COVERAGE_TRH) >= $SONAR_COVERAGE" | bc)
    if [ "$comparison_result" -eq 1 ];then
        echo "Failing sonar scan due to lack of code coverage"
        exit $(params.SONAR-EXIT-CODE)
    fi
else
  curl "$SONAR_HOST/api/measures/component?metricKeys=coverage&componentKey=$SONAR_PROJ" > sonar_scan_details
  cat sonar_scan_details
  echo "There is no code coverage value that, may be there are few issues or critical vulns found in scan"
  echo "Please check the sonar dashboard for more information"
  exit $(params.SONAR-EXIT-CODE)
fi

This code segment fetches the code coverage data from the SonarQube server and compares it against a specified threshold. If the code coverage falls below the threshold, the task will fail and exit with a specified exit code.

Terraform IAC test using Terratest

Automating Infrastructure Testing with Terratest

Infrastructure as Code (IaC) has transformed the way we manage and deploy cloud resources. However, ensuring that your IaC templates work as expected is crucial. This is where automated testing comes into play, and one of the most powerful tools for this job is Terratest. In this blog post, we’ll delve into what Terratest is, why it’s essential, and how you can leverage its capabilities to supercharge your infrastructure testing.

What is Terratest?

Terratest is a Go library designed to facilitate automated testing of your infrastructure code, especially when working with Terraform. It provides a rich set of helper functions and utilities that streamline the process of writing and executing tests for your infrastructure.

Why Use Terratest?

1. End-to-End Testing

Terratest allows you to perform end-to-end tests on your infrastructure code. This means you can spin up actual resources, apply your Terraform configurations, and validate that everything works as expected.

2. Support for Multiple Cloud Providers

Terratest is cloud-agnostic and supports various cloud providers like AWS, Azure, Google Cloud, and more. This flexibility ensures that you can test your infrastructure code regardless of the cloud platform you’re using.

3. Parallel Test Execution

With Terratest, you can run tests in parallel, which significantly reduces the time it takes to validate your infrastructure. This is especially valuable when you have a large number of tests to execute.

4. Integration with Testing Frameworks

Terratest integrates seamlessly with popular testing frameworks like Go’s testing package and others. This means you can incorporate infrastructure tests into your existing testing workflow.

Getting Started with Terratest

Installation

Getting started with Terratest is straightforward. Begin by installing the Go programming language, as Terratest is a Go library. Next, install Terratest using the go get command:

go get github.com/gruntwork-io/terratest/modules/terratest

Using Terratest with a Simple Terraform Module

Let’s walk through an example of using Terratest with a simple Terraform module that outputs “Hello, World!”.

terraform {
  required_version = ">= 0.12.26"
}

output "hello_world" {
  value = "Hello, World!"
}

In this Terraform module, we define an output called hello_world that simply returns the string “Hello, World!”.

Now, let’s create a Terratest to validate this Terraform module:

package test

import (
	"testing"

	"github.com/gruntwork-io/terratest/modules/terraform"
	"github.com/stretchr/testify/assert"
)

func TestTerraformHelloWorldExample(t *testing.T) {
	// retryable errors in terraform testing.
	terraformOptions := terraform.WithDefaultRetryableErrors(t, &terraform.Options{
		TerraformDir: "./",
	})

	defer terraform.Destroy(t, terraformOptions)

	terraform.InitAndApply(t, terraformOptions)

	output := terraform.Output(t, terraformOptions, "hello_world")
	assert.Equal(t, "Hello, World!", output)
}

In this example, we’re using Terratest to validate the Terraform module. It initializes and applies the Terraform configuration, retrieves the output, and asserts that it equals “Hello, World!”.

You can observe the test results as follows: alt text 
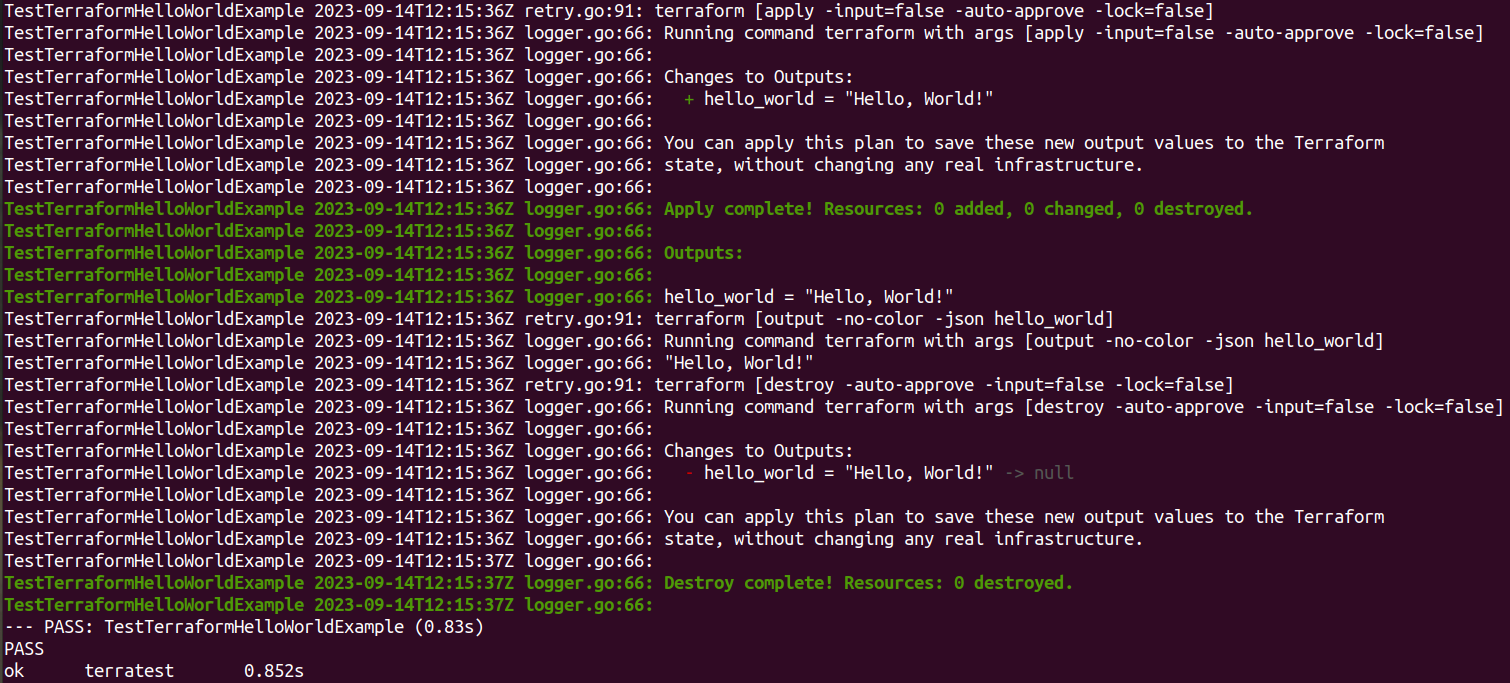
This is a simple example, but it demonstrates how you can use Terratest to automate the testing of your Terraform modules.

Conclusion

Terratest is a powerful tool for automating the testing of your infrastructure code. Its support for multiple cloud providers, parallel test execution, and seamless integration with testing frameworks make it an invaluable asset in your testing toolkit.

By incorporating Terratest into your workflow, you can ensure that your infrastructure code is reliable, robust, and ready for production.


Note: Always refer to the official Terratest documentation for the latest information and best practices.

Unit Testing with Codium and Jest

Unit Testing is mainly focused on testing every individual components called units. This allows us to ensure that all components code work as expected in all scenarios.

What is a Unit Test case?

  • Small, self-contained piece of code - to test a specific unit(component) for functionality.
  • can be : Functions, Methods, Classes or even small components depending on the software. Every unit test includes:
  1. Providing conditions to test components.
  2. Executing functionality of units.
  3. Checking component behaviour against expected results.

Why do we need unit testing?

Unit testing helps in many ways but mainly for:

  • Early detection of isses
  • Improving code quality
  • Faster debugging
  • Documentation
  • Continuous integration
  • Improving software design

Codium AI - writing unit test cases with codium

Codium AI is an IDE extension that interacts with the developers to generate meaningful tests and code explanations quickly. This will be useful to the developers to write test efficiently and quickly. CodiumAI analyzes your code, docstring, and comments, and then suggests tests as you code. Another thing about CodiumAI’s test generation feature is that it helps you find edge cases and corner cases that can otherwise be missed by us. This ensures that the code is thoroughly tested and helps catc potential bugs before they become bigger issues.

Adding CodiumAI to your VScode

In your VS code extensions marketplace, you should be able to see somethig like this:

Step 1: Install CodiumAI

codiumai

Step 2: Install Jest

jest

Step 3: Restart/ Reload VS code.

Lets take a sample code and see how this works. We’ll be using typescript as the programming language, Jest as the testing framework and test cases in CodiumAI.

calculate.ts

export default class Calculator {
    
  // Addition Function
  add(num1: number, num2: number): number {
      return num1 + num2;
  }

  // Subtraction Function
  subtract(num1: number, num2: number): number {
      return num1 - num2;
  }

  // Multiplication Function
  multiply(num1: number, num2: number): number {
      return num1 * num2;
  }

  // Division Function
  divide(num1: number, num2: number): number {
      if(num2 === 0){
          throw new Error("Division by zero error");
      }
      return num1 / num2;
  }
}

Your jest.config.js will look something like this:

module.exports = {
  transform: {
    '^.+\\.ts?$': 'ts-jest',
  },
  testEnvironment: 'node',
  testRegex: './src/.*\\.(test|spec)?\\.(ts|ts)$',
  moduleFileExtensions: ['ts', 'tsx', 'js', 'jsx', 'json', 'node'],
  roots: ['<rootDir>/src'],
};

Once we have everything - at the top of every function and method, CodiumAI adds “Test this function/method”. When you click on Test this the test cases appear on the side. You can either run each test case or run all of them at once.

CodiumAI test cases

If a test case fails - CodiumAI gives you an option to to Analyze failure so we can see what the issue is, right then and there.

Conclusion

You can also write unit test cases traditionally, by creating a test file - like for the above calculator.js code it’ll be calculator.spec.ts. For more on this you can look at Unit Test for beginners.

Button

Buttons - To allow users to make choices, take actions with a single click. Buttons are usually used in:

  • Forms
  • Tables
  • Cards
  • Toolbars

Import

import Button from '@intelops/intelops_ui/packages/react/components/Button/src';

Create a Button

 <Button
    variant="gradient"
    className="mybutton"
    size="medium"
    color="orange"
    onClick={handleButtonClick}>
    Button Name
</Button>

Props

NameTypeDescription
idstringUnique to each element can be used to lookup an element getElementById( )
childrennodeComponents content
classNametextTo add new or to override the applied styles
typetextthe type of button - can be given custom names and be used for grouping and styling
varianttextThe type of variant to use (all available button types in the table below)
hrefstringURL link to the page when you click the button
onClickfunctionTo handle clicks - applied to the DOM element
colorstringTo change buttons color

Variant Types (Available button types)

The button come in different styles, colors and sizes.

Button Style
VariantDescription
containedbasic button with a single colored background
gradientbutton with a gradient of 2 colors
outlinedbutton with a outline but no backgorund color
textbutton with colored text but no outline or background
setIconbutton with an icon instead of text
Button Color

Each button has 8 colors to choose from:

  1. fushia
  2. slate
  3. lime
  4. red
  5. orange
  6. cyan
  7. gray
  8. darkGray
Button Sizes

3 size options:

  • small
  • medium
  • large

Creating your own UI components

Don’t see the components you need, or the styling you want? You can always just create your own component.

Let’s create a custom Header component:

Step 1: Create a Header.js file in components folder.

import React, { useEffect, useState } from 'react';
import PropTypes from 'prop-types';
import styles from './header.module.css';
import Button from '../../Button/src/Button';

const Header = (props) => {
    const [headerRecord, setHeaderRecord] = useState(props.headerDetails);

    return (
        <div
            id="input sizing"
            className="flex place-items-center w-full min-h-[140px] bg-[#f8fafc] p-6 border border-blue-grey-50 rounded-lg scroll-mt-48 overflow-x-scroll lg:overflow-visible"
        >
            <div class="relative">
            <nav className={styles.navigation}>
                <ul class="relative flex flex-wrap p-1 list-none bg-transparent rounded-xl">
                    {/* {renderHeaderDetails} */}

                    {headerRecord &&
                        headerRecord.length > 0 &&
                        headerRecord.map((iteration, index) => {
                            //Parent elements

                            return (
                                <li class="z-30 flex-auto text-center">
                                    <a
                                        href={iteration.href}
                                        class="z-30 block w-full px-0 py-1 mb-0 transition-all border-0 rounded-lg ease-soft-in-out bg-inherit text-slate-700"
                                        active
                                        role="tab"
                                        aria-selected="true"
                                    >
                                        <span>{iteration.icon}</span>
                                        <span class="ml-1">{iteration.label}</span>
                                    </a>
                                </li>
                            );
                        })}
                </ul>
                </nav>
            </div>
            <div class="flex items-center md:ml-auto md:pr-4">
              {props.search ? (
                <div class="relative flex flex-wrap items-stretch w-full transition-all rounded-lg ease-soft">
                  <span class="text-sm ease-soft leading-5.6 absolute z-50 -ml-px flex h-full items-center whitespace-nowrap rounded-lg rounded-tr-none rounded-br-none border border-r-0 border-transparent bg-transparent py-2 px-2.5 text-center font-normal text-slate-500 transition-all">
                    <i class="fas fa-search" aria-hidden="true"></i>
                  </span>
                  <input
                    type="text"
                    class="pl-9 text-sm focus:shadow-soft-primary-outline dark:bg-gray-950 dark:placeholder:text-slate/80 dark:text-white/80 ease-soft w-1/100 leading-5.6 relative -ml-px block min-w-0 flex-auto rounded-lg border border-solid border-gray-300 bg-white bg-clip-padding py-2 pr-3 text-gray-700 transition-all placeholder:text-gray-500 focus:border-slate-600 focus:outline-slate-600 focus:transition-shadow"
                    placeholder="Type here..."
                  />
                </div>
              ) :(
                ""
              ) }
        {/* <button type="submit">Search</button> */}
        <Button
                variant="text"
                className="mybutton"
                size="small"
                color="orange"
              >
                Search
              </Button>
      </div>
        </div>
    );
};

Header.propTypes = {
    headetDetails: PropTypes.array
};

export default Header;

Step 2: Now add a css file for the Header.js file Header.css

/* Header.css */
.custom-header {
  display: flex;
  justify-content: space-between;
  align-items: center;
  padding: 20px;
  background-color: #ffffff;
  /* Add more styling as desired */
}

.logo img {
  height: 40px;
  /* Add more logo styling as desired */
}

.navigation ul {
  list-style: none;
  display: flex;
  /* Add more navigation styling as desired */
}

.navigation li {
  margin-right: 10px;
}

.search-bar input {
  /* Add styling for the search input */
}

.search-bar button {
  /* Add styling for the search button */
}

Step 3: We have the component but now we have to integrate it your main component file like- Intelops.js

import React from 'react';
import Header from './Header';

const Intelops = () => {
  return (
    <div>
      <Header />
      {/* Other content of your application */}
    </div>
  );
};

export default Intelops;

Step 4: Finally you need to render the Intelops in the root file like- index.js

import React from 'react';
import ReactDOM from 'react-dom';
import Intelops from './Intelops';

ReactDOM.render(
  <React.StrictMode>
    <Intelops />
  </React.StrictMode>,
  document.getElementById('root')
);

Icons

To use icons in our template you need to install Heroicons - svg icons by Tailwind CSS makers.

Installation:

npm install @heroicons/react

Usage

Now to use the icons - you have to import icons individually to use them.

import { ChartPieIcon } from '@heroicons/react/solid';
function MyComponent() {
  return (
    <div>
      <ChartPieIcon className="h-6 w-6 text-black-500" />
      <p>...</p>
    </div>
  )
}

IntelOps Frontend

Note: This entire document is only for internal team usage.

Overview

Note: This entire document is only for internal team usage.

IntelOps UI is a library with React UI components to design SASS websites.

Introduction

IntelOps UI is an open-source React component library that is used to implement IntelOps Website Design . It includes a collection of prebuilt components ready to use in production directly. All components are customizable and easy to implement your own custom designs for your websites.

Why IntelOps UI?

  • Customizability: the library has a lot of customizable features. The components clearly show all the ways that you can customize your components.
  • Open-Source: Many open-source contributors worked together to create these components so that companies can focus on the buisness logic instead of working on their UI from scratch.

Tracetest

Design of the BPF Ring Buffer

The BPF ring buffer provides a flexible and efficient mechanism for data exchange between the Linux kernel and user-space programs. In this section, we will dive into the design and implementation details of the BPF ring buffer, exploring its features and underlying principles.

Reserve/Commit Schema for Multiple Producers

The BPF ring buffer is designed to accommodate multiple producers, whether they are running on different CPUs or within the same BPF program. The reserve/commit schema allows producers to independently reserve records and work with them without blocking other producers. If a BPF program is interrupted by another program sharing the same ring buffer, both programs can reserve a record (given enough space is available) and process it independently. This also holds true for Non-Maskable Interrupt (NMI) context, although reservation in the NMI context may fail due to spinlock contention even if the ring buffer is not full.

Circular Buffer with Logical Counters

Internally, the ring buffer is implemented as a circular buffer with a size that is a power of 2. It utilizes two logical counters that continually increase (and may wrap around on 32-bit architectures):

Consumer Counter

Indicates the logical position up to which the consumer has consumed the data.

Producer Counter

Denotes the amount of data reserved by all producers.

When a record is reserved, the producer responsible for that record successfully advances the producer counter. At this stage, the data is not yet ready for consumption. Each record has an 8-byte header that includes the length of the reserved record and two additional bits: the busy bit, indicating that the record is still being processed, and the discard bit, which can be set at commit time if the record should be discarded. The record header also encodes the relative offset of the record from the beginning of the ring buffer data area in pages. This design choice allows the bpf_ringbuf_commit() and bpf_ringbuf_discard() functions to accept only the pointer to the record itself, simplifying the verifier and improving the API’s usability.

Serialization and Ordering


Producer counter increments are serialized under a spinlock, ensuring strict ordering between reservations. On the other hand, commits are completely lockless and independent. All records become available to the consumer in the order of their reservations but only after all preceding records have been committed. This means that slow producers may temporarily delay the submission of records that were reserved later.

Contiguous Memory Mapping


One notable implementation aspect that simplifies and speeds up both producers and consumers is the double contiguous memory mapping of the data area. The ring buffer’s data area is mapped twice back-to-back in virtual memory, enabling samples that wrap around at the end of the circular buffer to appear as completely contiguous in virtual memory. This design eliminates the need for special handling of samples that span the circular buffer’s boundary, improving both performance and implementation simplicity.

Self-Pacing Notifications


The BPF ring buffer introduces self-pacing notifications for new data availability. When a record is committed using bpf_ringbuf_commit(), a notification is sent only if the consumer has already caught up with the record being committed. If the consumer is not yet up to date, it will eventually catch up and see the new data without requiring an extra poll notification. This self-pacing mechanism allows the BPF ring buffer to achieve high throughput without the need for tricks like “notify only every Nth sample,” which are necessary with the perf buffer. For cases where BPF programs require more manual control over notifications, the commit/discard/output helpers accept flags such as BPF_RB_NO_WAKEUP and BPF_RB_FORCE_WAKEUP. These flags provide full control over data availability notifications but require careful and diligent usage to

BPF Ring Buffer

eBPF Hook's

Building-DB-Layer

Let’s start by building database layer

To create a database layer for the Person service, you can use a database library like gorm. Here’s an example of how you can define a Person model and create a database connection using gorm:

  • creating a DB instance and estabishing connection with the database.
package database

import (
	"fmt"

	"gorm.io/driver/mysql"
	"gorm.io/gorm"
)

type Person struct {
	gorm.Model
	Name  string
	Email string
	Phone string
}

func NewDB() (*gorm.DB, error) {
	// replace these values with your actual database connection parameters
	dsn := "user:password@tcp(localhost:3306)/database_name?charset=utf8mb4&parseTime=True&loc=Local"

	db, err := gorm.Open(mysql.Open(dsn), &gorm.Config{})
	if err != nil {
		return nil, fmt.Errorf("failed to connect to database: %v", err)
	}

	// migrate the Person table to the database
	err = db.AutoMigrate(&Person{})
	if err != nil {
		return nil, fmt.Errorf("failed to migrate database: %v", err)
	}

	return db, nil
}

In this example, we define a Person model using the gorm.Model struct, which provides the basic fields like ID, CreatedAt, UpdatedAt and DeletedAt. We then define a NewDB() function which creates a new database connection using the mysql driver and the provided DSN. We also call the AutoMigrate() method on the database connection to automatically create the Person table in the database.

Note that you will need to replace the DSN string with the actual connection parameters for your database. You will also need to import the gorm and mysql packages.

Once you have the Person model and the database connection, you can use the gorm methods to implement the PersonService interface methods. For example, to implement the CreatePerson method, you can use the following code:

func (s *personServer) CreatePerson(ctx context.Context, req *api.CreatePersonRequest) (*api.CreatePersonResponse, error) {
	// create a new Person instance from the request data
	p := &database.Person{
		Name:  req.Name,
		Email: req.Email,
		Phone: req.Phone,
	}
  • inserting a new person into the database

	// insert the new Person into the database
	err := s.db.Create(p).Error
	if err != nil {
		return nil, status.Errorf(codes.Internal, "failed to create person: %v", err)
	}
  • creating a response with the ID of newly created person

	// create a response with the ID of the newly created Person
	res := &api.CreatePersonResponse{
		Id: uint64(p.ID),
	}

	return res, nil
}

In this example, we create a new Person instance from the request data and insert it into the database using the Create() method on the s.db database connection. We then create a response with the ID of the newly created Person and return it to the client. Note that we use the status package from google.golang.org/grpc/status to return gRPC status codes and error messages.

Create-Dashboards-With-Jsonnet

This article will demonstrate how to create grafana dashboards using go-jsonnet library

Here’s a basic example of how you can use go-jsonnet to evaluate a Jsonnet template and generate Grafana dashboard JSON:

  • Step 1: Define a Jsonnet template
func main() {
	// Define a Jsonnet template
	template := 
	{
		"title": "Example Dashboard",
		"panels": [
			{
				"type": "graph",
				"title": "Example Graph",
				"targets": [
					{
						"query": "SELECT count(*) FROM example_table"
					}
				]
			}
		]
	}
  • Step 2 Create a Jsonnet VM
vm := jsonnet.MakeVM()
  • Step 3 Evaluate the template
jsonString, err := vm.EvaluateSnippet("example.jsonnet", template)
	if err != nil {
		panic(err)
	}
  • Step 4 Convert the JSON string to a map
var dashboard map[string]interface{}
	err = json.Unmarshal([]byte(jsonString), &dashboard)
	if err != nil {
		panic(err)
	}
  • Step 5 Print the resulting dashboard JSON
jsonBytes, err := json.MarshalIndent(dashboard, "", "    ")
	if err != nil {
		panic(err)
	}
	fmt.Println(string(jsonBytes))
}

This example defines a simple Jsonnet template for a Grafana dashboard, evaluates it using a Jsonnet VM, and then converts the resulting JSON string to a map using the json.Unmarshal() function. The resulting map can then be further manipulated or serialized as needed.

Note that this is just a basic example, and there are many ways to extend and customize this approach for your specific needs

The next article will tell you about how to create a Jsonnet library that defines a set of functions and objects for creating and configuring the components of your dashboard in the frontend.

Exploring eBPF Probes: Observing TCP Connections with Kernel-Level Instrumentation

The provided eBPF kernel-side program is a kprobe program attached to the __x64_sys_tcp_connect function, which is a system call handler for tcp_connect on x64 systems. Let’s go through the program step by step:

SEC("kprobe/__x64_sys_tcp_connect")
int kprobe__tcp_connect(struct pt_regs *ctx)
{
    struct sock *sk = (struct sock *)PT_REGS_PARM1(ctx);
    struct sock_common conn = READ_KERN(sk->__sk_common);
    struct sockaddr_in sockv4;
    struct sockaddr_in6 sockv6;

    sys_context_t context = {};
    args_t args = {};
    u64 types = ARG_TYPE0(STR_T) | ARG_TYPE1(SOCKADDR_T);

    init_context(&context);
    context.argnum = get_arg_num(types);
    context.retval = PT_REGS_RC(ctx);

    if (context.retval >= 0 && drop_syscall(_NETWORK_PROBE))
    {
        return 0;
    }

    if (get_connection_info(&conn, &sockv4, &sockv6, &context, &args, _TCP_CONNECT) != 0)
    {
        return 0;
    }

    args.args[0] = (unsigned long)conn.skc_prot->name;
    set_buffer_offset(DATA_BUF_TYPE, sizeof(sys_context_t));
    bufs_t *bufs_p = get_buffer(DATA_BUF_TYPE);
    if (bufs_p == NULL)
        return 0;
    save_context_to_buffer(bufs_p, (void *)&context);
    save_args_to_buffer(types, &args);
    events_perf_submit(ctx);

    return 0;
}

The program starts with the definition of the kprobe function kprobe__tcp_connect, which takes a pointer to struct pt_regs (ctx) as an argument.

The program declares and initializes several variables:

  1. struct sock *sk:
struct sock *sk = (struct sock *)PT_REGS_PARM1(ctx);

It represents the socket object obtained from the first parameter of the system call.It retrieves the socket object from the function arguments and stores it in the sk variable for further processing within the eBPF program.

  • PT_REGS_PARM1(ctx): This macro is used to access the value of the second parameter (parm1) of the function, which is represented by the ctx pointer to struct pt_regs.

  • (struct sock *): The obtained value from PT_REGS_PARM1(ctx) is cast to a pointer of type struct sock *. This is done to interpret the value as a socket object.

  • struct sock *sk: This line declares a variable named sk of type struct sock * and assigns the obtained socket object to it.

  1. struct sock_common conn:
struct sock_common conn = READ_KERN(sk->__sk_common);
  • It is used to read the value of the __sk_common field from the sk socket object and store it in a struct sock_common variable named conn.

Let’s break down the code:

  • sk->__sk_common: This accesses the __sk_common field within the sk socket object. The __sk_common field is a member of the sk structure and represents the common data shared by different socket types.

  • READ_KERN(...): The READ_KERN macro is used to read kernel memory. In this case, it reads the value of sk->__sk_common from the kernel memory space.

  • struct sock_common conn: This line declares a variable named conn of type struct sock_common and assigns the value read from sk->__sk_common to it.

This allows subsequent access to the common socket information for further processing within the eBPF program.

  1. struct sockaddr_in sockv4 and struct sockaddr_in6 sockv6
    struct sockaddr_in sockv4;
    struct sockaddr_in6 sockv6;
  • The lines struct sockaddr_in sockv4; and struct sockaddr_in6 sockv6; declare two variables, sockv4 and sockv6, respectively. These variables are of types struct sockaddr_in and struct sockaddr_in6, which are used to represent socket addresses for IPv4 and IPv6 protocols.

Here’s a brief explanation of these structures:

  1. struct sockaddr_in:

    • This structure is defined in the <netinet/in.h> header file.
    • It represents an IPv4 socket address.
    • It has the following members:
      • sin_family: The address family, which is typically set to AF_INET for IPv4.
      • sin_port: The port number associated with the socket address.
      • sin_addr: The IPv4 address, stored as an in_addr structure.
      • sin_zero: Padding to ensure structure alignment.
  2. struct sockaddr_in6:

    • This structure is also defined in the <netinet/in.h> header file.
    • It represents an IPv6 socket address.
    • It has the following members:
      • sin6_family: The address family, usually set to AF_INET6 for IPv6.
      • sin6_port: The port number associated with the socket address.
      • sin6_flowinfo: IPv6 flow information.
      • sin6_addr: The IPv6 address, stored as an in6_addr structure.
      • sin6_scope_id: Scope ID for link-local addresses.
      • sin6_padding: Padding for future use.

In the given code, the variables sockv4 and sockv6 are declared to store socket addresses of type IPv4 and IPv6, respectively. These variables used in the get_connection_info function to populate the socket address information based on the connection details being processed by the eBPF program.

  1. Here’s a brief explanation of these lines:
    sys_context_t context = {};
    args_t args = {};

The lines sys_context_t context = {}; and args_t args = {}; declare and initialize variables context and args, respectively, with empty or zero-initialized values.

sys_context_t context = {};:
  • This line declares a variable named context of type sys_context_t.
  • The sys_context_t type is a user-defined structure or typedef representing the context or state of the system.
  • The {} initializer initializes the context variable, setting all its members to their default or zero values.

This line is commonly used to ensure that the context variable starts with default values before being populated or used further in the program.

args_t args = {};:
  • This line declares a variable named args of type args_t.
  • The args_t type is a user-defined structure or typedef representing arguments or parameters used in a certain context or function.
  • The {} initializer initializes the args variable, setting all its members to their default or zero values.

Similar to the previous line, this initialization ensures that the args variable starts with default values before being assigned or utilized in subsequent program logic. By initializing these variables to empty or zero values, it provides a clean and consistent starting point for the context and args structures, allowing them to be populated with specific data as required by the program’s logic.

  1. Here’s a brief explanation of these lines:
   u64 types = ARG_TYPE0(STR_T) | ARG_TYPE1(SOCKADDR_T);

The line u64 types = ARG_TYPE0(STR_T) | ARG_TYPE1(SOCKADDR_T); defines a variable types of type u64(unsigned 64-bit integer) and assigns it a value calculated using the macros ARG_TYPE0() and ARG_TYPE1().

// Definition of ENC_ARG_TYPE,ARG_TYPE0
#define MAX_ARGS 6
#define ENC_ARG_TYPE(n, type) type << (8 * n)
#define ARG_TYPE0(type) ENC_ARG_TYPE(0, type)
#define ARG_TYPE1(type) ENC_ARG_TYPE(1, type)
#define ARG_TYPE2(type) ENC_ARG_TYPE(2, type)
#define ARG_TYPE3(type) ENC_ARG_TYPE(3, type)
#define ARG_TYPE4(type) ENC_ARG_TYPE(4, type)
#define ARG_TYPE5(type) ENC_ARG_TYPE(5, type)
#define DEC_ARG_TYPE(n, type) ((type >> (8 * n)) & 0xFF)

Here

#define ARG_TYPE0(type) ENC_ARG_TYPE(0, type)

The macro ENC_ARG_TYPE(n, type) is defined with the purpose of encoding an argument type type at a specific position n within a 64-bit value. Here’s a breakdown of how it works:

The macro definition ENC_ARG_TYPE(n, type) type << (8 * n) consists of two parts:

  1. type: It represents the argument type that needs to be encoded. It is provided as an argument to the macro.

  2. << (8 * n): It performs a left shift operation on the type value by 8 * n bits. This shift operation moves the bits of type to the left by a certain number of positions determined by n.

  • The value 8 corresponds to the number of bits occupied by one byte.
  • The variable n determines the position within the 64-bit value where the type will be encoded.
  • Multiplying 8 by n calculates the number of bits by which the type value should be shifted to the left to occupy the desired position. The resulting value of type after the left shift operation represents the encoded argument type at the specified position n within the 64-bit value.
#define ARG_TYPE0(type) ENC_ARG_TYPE(0, type)

The macro ARG_TYPE0(type) is defined as a convenience macro that uses the ENC_ARG_TYPE(n, type) macro to encode an argument type type at position 0 within a 64-bit value. Here’s how it works:

The macro definition ARG_TYPE0(type) ENC_ARG_TYPE(0, type) expands to the following:

  1. ENC_ARG_TYPE(0, type): This macro is called with arguments 0 and type, which represents the position and type of the argument to be encoded.

  2. ENC_ARG_TYPE(n, type) type << (8 * n): The ENC_ARG_TYPE(n, type) macro is invoked with 0 as the position n and type as the argument type. It performs a left shift operation on the type value by 8 * 0 bits, effectively encoding the type at position 0.

In summary, ARG_TYPE0(type) is a shorthand macro that encodes the argument type type at position 0 within a 64-bit value. It simplifies the encoding process by providing a clear and concise way to specify the position of the argument type. The resulting encoded value can be used as a bitmask or flag to represent the argument type within the program.

These macros allow for convenient encoding and decoding of argument types used in the program. Here’s a breakdown of the relevant macros and their corresponding type values:

  1. ARG_TYPE0(type): This macro takes an argument type (type)and encodes it at position 0. It uses the ENC_ARG_TYPE(n, type) macro to calculate the encoded value by shifting the type value type by 8 * n bits, where n is the position.
  2. ARG_TYPE1(type): Similar to ARG_TYPE0, but encodes the type at position 1. In this specific case, STR_T and SOCKADDR_T are type values associated with string and socket address types, respectively.

The | operator is used to perform a bitwise OR operation between the encoded values of STR_T and SOCKADDR_T, resulting in a combined type value.

Finally, the combined type value is assigned to the types variable of type u64. The types variable can now be used as a bitmask or flag to represent multiple argument types within the program.

  1.  init_context(&context);
    
  • The line init_context(&context); is a function call that invokes the init_context function and passes the address of the context variable as an argument. This call initializes the sys_context_t object context by populating its members with relevant information based on the current task.

  • By calling init_context(&context);, the context object is prepared to store context-specific information such as the timestamp, process IDs, parent process ID, user ID, and command name associated with the current task. Once the function call completes, the context object will hold the initialized values, ready for further use or analysis in the program.


#define TASK_COMM_LEN 16
typedef struct __attribute__((__packed__)) sys_context
{
    u64 ts;

    u32 pid_id;
    u32 mnt_id;

    u32 host_ppid;
    u32 host_pid;

    u32 ppid;
    u32 pid;
    u32 uid;

    u32 event_id;
    u32 argnum;
    s64 retval;

    char comm[TASK_COMM_LEN];
} sys_context_t;
  1. The code snippet provided defines a data structure called sys_context_t, which represents the context information associated with a system event. The sys_context_t structure has the following members:
  • ts: Represents the timestamp of the event.
  • pid_id and mnt_id: Store the process ID, namespace ID and mount namespace ID, respectively.
  • host_ppid and host_pid: Store the parent process ID and process ID of the host.
  • ppid and pid: Store the parent process ID and process ID within the container or host, depending on the configuration.
  • uid: Represents the user ID associated with the event.
  • event_id: Represents the ID of the event.
  • argnum: Indicates the number of arguments associated with the event.
  • retval: Stores the return value of the event.
  • comm: Represents the command name associated with the task, stored as a character array with a maximum length defined by TASK_COMM_LEN.
// == Context Management == //

static __always_inline u32 init_context(sys_context_t *context)
{
    struct task_struct *task = (struct task_struct *)bpf_get_current_task();

    context->ts = bpf_ktime_get_ns();

    context->host_ppid = get_task_ppid(task);
    context->host_pid = bpf_get_current_pid_tgid() >> 32;

#if defined(MONITOR_HOST)

    context->pid_id = 0;
    context->mnt_id = 0;

    context->ppid = get_task_ppid(task);
    context->pid = bpf_get_current_pid_tgid() >> 32;

#else // MONITOR_CONTAINER or MONITOR_CONTAINER_AND_HOST

    u32 pid = get_task_ns_tgid(task);
    if (context->host_pid == pid)
    { // host
        context->pid_id = 0;
        context->mnt_id = 0;

        context->ppid = get_task_ppid(task);
        context->pid = bpf_get_current_pid_tgid() >> 32;
    }
    else
    { // container
        context->pid_id = get_task_pid_ns_id(task);
        context->mnt_id = get_task_mnt_ns_id(task);

        context->ppid = get_task_ns_ppid(task);
        context->pid = pid;
    }

#endif /* MONITOR_CONTAINER || MONITOR_HOST */

    context->uid = bpf_get_current_uid_gid();

    bpf_get_current_comm(&context->comm, sizeof(context->comm));

    return 0;
}

The provided code snippet is a continuation of the previous code. It includes the implementation of the init_context function, which is responsible for initializing the sys_context_t structure with relevant context information.

Let’s go through the code step by step:

  1. struct task_struct *task = (struct task_struct *)bpf_get_current_task();: This line retrieves the current task (process) using the bpf_get_current_task() BPF helper function. It casts the task to the task_struct structure.

  2. context->ts = bpf_ktime_get_ns();: This line assigns the current timestamp, obtained using the bpf_ktime_get_ns() BPF helper function, to the ts member of the context structure.

3.context->host_ppid = get_task_ppid(task);: This line retrieves the parent process ID (PPID) of the current task using the get_task_ppid() function and assigns it to the host_ppid member of the context structure.

  1. context->host_pid = bpf_get_current_pid_tgid() >> 32;: This line retrieves the process ID (PID) and thread group ID (TGID) of the current task using the bpf_get_current_pid_tgid() BPF helper function. It shifts the 64-bit value right by 32 bits to obtain the PID and assigns it to the host_pid member of the context structure.

  2. The code block starting with #if defined(MONITOR_HOST) and ending with #else or #endif is conditional compilation based on the presence of the MONITOR_HOST macro. Depending on the configuration, the code inside the corresponding block will be included in the final program.

  3. If MONITOR_HOST is defined, the code block inside #if defined(MONITOR_HOST) is executed. It sets pid_id and mnt_id to 0, indicating that the current task is running in the host environment. It also assigns the host PPID and PID to ppid and pid members, respectively.

  4. If MONITOR_HOST is not defined, the code block inside #else or #endif is executed. It checks if the host_pid is equal to the PID obtained from the task’s namespace (pid). If they are equal, it means the current task is running in the host environment. In that case, pid_id and mnt_id are set to 0, and the host PPID and PID are assigned to ppid and pid members, respectively.

  5. If the condition in step 7 is not met, it means the current task is running in a container. The code inside the else block assigns the PID namespace ID and mount namespace ID to pid_id and mnt_id members, respectively. It also retrieves the container's PPID and PID from the task's namespace and assigns them to ppid and pid members, respectively.

  6. context->uid = bpf_get_current_uid_gid();: This line retrieves the user ID (UID) associated with the current task using the bpf_get_current_uid_gid() BPF helper function and assigns it to the uid member of the context structure.

  7. bpf_get_current_comm(&context->comm, sizeof(context->comm));: This line retrieves the command name (executable name) associated with the current task and copies it to the comm member of the context structure. The sizeof(context->comm) specifies the size of the destination buffer.

Finally, the function returns 0, indicating successful initialization of the context.

Overall, the init_context function initializes the sys_context_t structure by populating its members with relevant context information obtained from the current task.

  1.  context.argnum = get_arg_num(types);
     context.retval = PT_REGS_RC(ctx);
    
  2. context.argnum = get_arg_num(types);: This line calls the get_arg_num function with the types argument and assigns the returned value to the argnum member of the context structure. The types variable represents a bitmask of argument types, which determines the number of arguments present in the function call. The get_arg_num function calculates the number of arguments based on the bitmask and returns the result.

    static __always_inline int get_arg_num(u64 types)
     {
        unsigned int i, argnum = 0;
    
    #pragma unroll
    for (i = 0; i < MAX_ARGS; i++)
    {
        if (DEC_ARG_TYPE(i, types) != NONE_T)
            argnum++;
    }
    
    return argnum;
    }
    

The code snippet shows the implementation of the get_arg_num function. This function takes a bitmask types as an argument and returns the number of arguments based on the bitmask.

Here’s how the function works:

  1. It initializes two variables: i for the loop counter and argnum to keep track of the number of arguments.

  2. The for loop iterates over MAX_ARGS number of times. MAX_ARGS is a constant defined as 6 code, representing the maximum number of arguments.

  3. Inside the loop, it checks the argument type for each position i in the bitmask using the DEC_ARG_TYPE(i, types) macro. The DEC_ARG_TYPE macro extracts the argument type from the bitmask based on the position i.

  4. If the argument type is not NONE_T (indicating that there is an argument at that position), it increments the argnum counter.

  5. After the loop, it returns the final value of argnum, which represents the total number of arguments present in the bitmask.

In summary, the get_arg_num function iterates over the bitmask of argument types and counts the number of non-zero argument types, returning the total count as the result.

  1. 
     if (context.retval >= 0 && drop_syscall(_NETWORK_PROBE))
     {
         return 0;
     }
    
  • context.retval >= 0: This condition checks if the value of context.retval (which represents the return value of a system call) is greater than or equal to 0. This condition ensures that the system call executed successfully.

  • drop_syscall(_NETWORK_PROBE): This condition calls the drop_syscall function with the _NETWORK_PROBE scope as an argument. If this function returns a non-zero value, indicating that the system call should be dropped, the condition evaluates to true.

If both conditions are true, meaning the system call executed successfully and should be dropped based on the provided scope, the code block within the if statement will be executed.

    enum
    {
    _FILE_PROBE = 0,
    _PROCESS_PROBE = 1,
    _NETWORK_PROBE = 2,
    _CAPS_PROBE = 3,

    _TRACE_SYSCALL = 0,
    _IGNORE_SYSCALL = 1,
    };

    struct outer_key    
    {   
    u32 pid_ns;
    u32 mnt_ns;
    };


    static __always_inline u32 drop_syscall(u32 scope)
    {
    struct outer_key okey;
    struct task_struct *task = (struct task_struct *)bpf_get_current_task();
    get_outer_key(&okey, task);

    u32 *ns_visibility = bpf_map_lookup_elem(&kubearmor_visibility, &okey);
    if (!ns_visibility)
    {
        return _TRACE_SYSCALL;
    }

    u32 *on_off_switch = bpf_map_lookup_elem(ns_visibility, &scope);
    if (!on_off_switch)
    {
        return _TRACE_SYSCALL;
    }

    if (*on_off_switch)
        return _IGNORE_SYSCALL;
    return _TRACE_SYSCALL;
    }


    static __always_inline void get_outer_key(struct outer_key *pokey,
                                          struct task_struct *t)
    {
    pokey->pid_ns = get_task_pid_ns_id(t);
    pokey->mnt_ns = get_task_mnt_ns_id(t);
    if (pokey->pid_ns == PROC_PID_INIT_INO)
    {
        pokey->pid_ns = 0;
        pokey->mnt_ns = 0;
    }
    }

The drop_syscall function is used to determine whether a syscall should be dropped or traced based on the provided scope.

Here’s a breakdown of the function:

  1. It starts by defining a structure struct outer_key and obtaining the current task using bpf_get_current_task().

  2. The function then calls get_outer_key to populate the okey structure with relevant information based on the current task.

  3. It looks up the value associated with the okey in the kubearmor_visibility map using bpf_map_lookup_elem. If the lookup fails (!ns_visibility), it returns _TRACE_SYSCALL, indicating that the syscall should be traced.

  4. Next, it looks up the value associated with the scope in the ns_visibility map using bpf_map_lookup_elem. If the lookup fails (!on_off_switch), it returns _TRACE_SYSCALL, again indicating that the syscall should be traced.

  5. If the lookup succeeds, it checks the value pointed to by on_off_switch. If it is non-zero (*on_off_switch is true), it returns _IGNORE_SYSCALL, indicating that the syscall should be dropped.

If none of the previous conditions are met, it returns _TRACE_SYSCALL, indicating that the syscall should be traced.

Overall, this function is responsible for determining whether a syscall should be dropped or traced based on the provided scope and the information stored in the kubearmor_visibility map.

10.Here’s a brief explanation of these lines:

 if (get_connection_info(&conn, &sockv4, &sockv6, &context, &args, _TCP_CONNECT) != 0)
    {
        return 0;
    }

This snippet checks the return value of the function get_connection_info against zero. If the return value is not equal to zero, the code block within the if statement is executed, and the function or block of code that contains this snippet returns 0.

  1. Here’s a brief explanation of these lines:
    args.args[0] = (unsigned long)conn.skc_prot->name;

The code snippet assigns the value of conn.skc_prot->name to args.args[0]. It appears that args is a structure or array with a member called args, which is an array or a structure itself.

By using (unsigned long)conn.skc_prot->name, it converts the value of conn.skc_prot->name to an unsigned long type and assigns it to args.args[0].

  1. Here’s a brief explanation of these lines:
    set_buffer_offset(DATA_BUF_TYPE, sizeof(sys_context_t));

In this specific case, the function call set_buffer_offset(DATA_BUF_TYPE, sizeof(sys_context_t)) updates the value of the element in the bufs_offset array with the index DATA_BUF_TYPE (0). The new value assigned to that element is the size of the sys_context_t structure, obtained using sizeof(sys_context_t).

Required definiton

#define DATA_BUF_TYPE 0
#define EXEC_BUF_TYPE 1
#define FILE_BUF_TYPE 2

static __always_inline void set_buffer_offset(int buf_type, u32 off)
{
    bpf_map_update_elem(&bufs_offset, &buf_type, &off, BPF_ANY);
}

The set_buffer_offset function takes two arguments: buf_type (the buffer type) and off (the offset value). It updates the corresponding element in the bufs_offset array with the provided off value using the bpf_map_update_elem function.

BPF_PERCPU_ARRAY(bufs_offset, u32, 3);

There is a BPF per-CPU array named bufs_offset defined with a size of 3. This array is used to store the offset values for different buffer types.

This code is useful for maintaining and accessing offset values associated with different buffer types in the BPF program. It allows the BPF program to efficiently calculate the memory locations for specific buffer types based on the provided offsets.

  1. Here’s a brief explanation of these lines:
    bufs_t *bufs_p = get_buffer(DATA_BUF_TYPE);

It declares a pointer variable bufs_p of type bufs_t*, and assigns it the value returned by the get_buffer function when called with the DATA_BUF_TYPE parameter.

The get_buffer function, retrieves an element from the bufs map based on the provided buffer type. Since bufs_p is assigned the returned pointer, it will point to the bufs_t structure corresponding to the DATA_BUF_TYPE in the bufs map.

This allows you to access and manipulate the data stored in the buffer through the bufs_p pointer.

Required definition

typedef struct buffers
{
    u8 buf[MAX_BUFFER_SIZE];
} bufs_t; 

static __always_inline bufs_t *get_buffer(int buf_type)
{
    return bpf_map_lookup_elem(&bufs, &buf_type);
}

The code snippet defines a structure bufs_t that contains a byte array buf with a maximum size defined by MAX_BUFFER_SIZE.

The get_buffer function is declared as an inline function, which is always inlined at the call site to optimize performance. This function takes an integer parameter buf_type and returns a pointer to a bufs_t structure.

Within the get_buffer function, bpf_map_lookup_elem is used to retrieve an element from the bufs map.The first parameter of bpf_map_lookup_elem is the map object (&bufs), and the second parameter is the key used to lookup the element (&buf_type).

The function returns a pointer to the retrieved bufs_t structure.

BPF_PERCPU_ARRAY(bufs, bufs_t, 3);

The code snippet declares a BPF per-CPU array named bufs that can store elements of type bufs_t. The array has a size of 3, indicating that it can hold three elements.

A BPF per-CPU array is an array data structure in eBPF that allows each CPU to have its own private copy of the array. This is useful in scenarios where concurrent access to the array from multiple CPUs needs to be managed efficiently.

In this case, the bufs array is defined to store elements of type bufs_t, which is a structure containing a byte array buf with a maximum size defined by MAX_BUFFER_SIZE.

By declaring a per-CPU array, the BPF program can efficiently store and access buffers of type bufs_t per CPU. Each CPU will have its own private copy of the array,` enabling concurrent access without requiring synchronization mechanisms.

  1. Here’s a brief explanation of these lines:
    if (bufs_p == NULL)
        return 0;

Checks if the bufs_p pointer is NULL, indicating that the corresponding buffer was not found in the bufs map.

If bufs_p is NULL, it means that the buffer retrieval failed, and the code returns 0 to indicate an error or failure condition.

  1. Here’s a brief explanation of these lines:
    save_context_to_buffer(bufs_p, (void *)&context);

save_context_to_buffer(bufs_p, (void *)&context); calls the save_context_to_buffer function with bufs_p as the buffer pointer and (void *)&context as the pointer to the context data.

The function save_context_to_buffer attempts to save the context data pointed to by (void *)&contextinto the buffer pointed to bybufs_p.` If the save operation is successful, it returns the size of the context data (sizeof(sys_context_t).

Where , save_context_to_buffer is defined as

static __always_inline int save_context_to_buffer(bufs_t *bufs_p, void *ptr)
{
    if (bpf_probe_read(&(bufs_p->buf[0]), sizeof(sys_context_t), ptr) == 0)
    {
        return sizeof(sys_context_t);
    }

    return 0;
}

The function save_context_to_buffer is used to save the context data pointed to by ptr into the buffer bufs_p. Here’s how the function works:

  1. It attempts to read the data from ptr using bpf_probe_read and stores it in the buffer bufs_p->buf[0]. The size of the data being read is sizeof(sys_context_t).

  2. If the read operation succeeds (indicated by bpf_probe_read returning 0), it returns sizeof(sys_context_t) to indicate the number of bytes saved to the buffer.

  3. If the read operation fails (indicated by bpf_probe_read returning a non-zero value), it returns 0 to indicate that the save operation failed.

Overall, the function attempts to save the context data to the buffer and returns the number of bytes saved if successful, or 0 if it fails.

  1. Here’s a brief explanation of these lines:
save_args_to_buffer(types, &args);

save_args_to_buffer(types, &args); is a function call to the save_args_to_buffer function, which is responsible for saving the arguments to the buffer.

In this function call, types is a variable representing the types of arguments, and args is a pointer to the args_t structure that holds the argument values.

By calling save_args_to_buffer(types, &args), the function will process the arguments based on their types and save them to the buffer.

static __always_inline int save_args_to_buffer(u64 types, args_t *args)
{
    if (types == 0)
    {
        return 0;
    }

    bufs_t *bufs_p = get_buffer(DATA_BUF_TYPE);
    if (bufs_p == NULL)
    {
        return 0;
    }

#pragma unroll
    for (int i = 0; i < MAX_ARGS; i++)
    {
        switch (DEC_ARG_TYPE(i, types))
        {
        case NONE_T:
            break;
        case INT_T:
            save_to_buffer(bufs_p, (void *)&(args->args[i]), sizeof(int), INT_T);
            break;
        case OPEN_FLAGS_T:
            save_to_buffer(bufs_p, (void *)&(args->args[i]), sizeof(int), OPEN_FLAGS_T);
            break;
        case FILE_TYPE_T:
            save_file_to_buffer(bufs_p, (void *)args->args[i]);
            break;
        case PTRACE_REQ_T:
            save_to_buffer(bufs_p, (void *)&(args->args[i]), sizeof(int), PTRACE_REQ_T);
            break;
        case MOUNT_FLAG_T:
            save_to_buffer(bufs_p, (void *)&(args->args[i]), sizeof(int), MOUNT_FLAG_T);
            break;
        case UMOUNT_FLAG_T:
            save_to_buffer(bufs_p, (void *)&(args->args[i]), sizeof(int), UMOUNT_FLAG_T);
            break;
        case STR_T:
            save_str_to_buffer(bufs_p, (void *)args->args[i]);
            break;
        case SOCK_DOM_T:
            save_to_buffer(bufs_p, (void *)&(args->args[i]), sizeof(int), SOCK_DOM_T);
            break;
        case SOCK_TYPE_T:
            save_to_buffer(bufs_p, (void *)&(args->args[i]), sizeof(int), SOCK_TYPE_T);
            break;
        case SOCKADDR_T:
            if (args->args[i])
            {
                short family = 0;
                bpf_probe_read(&family, sizeof(short), (void *)args->args[i]);
                switch (family)
                {
                case AF_UNIX:
                    save_to_buffer(bufs_p, (void *)(args->args[i]), sizeof(struct sockaddr_un), SOCKADDR_T);
                    break;
                case AF_INET:
                    save_to_buffer(bufs_p, (void *)(args->args[i]), sizeof(struct sockaddr_in), SOCKADDR_T);
                    break;
                case AF_INET6:
                    save_to_buffer(bufs_p, (void *)(args->args[i]), sizeof(struct sockaddr_in6), SOCKADDR_T);
                    break;
                default:
                    save_to_buffer(bufs_p, (void *)&family, sizeof(short), SOCKADDR_T);
                }
            }
            break;
        case UNLINKAT_FLAG_T:
            save_to_buffer(bufs_p, (void *)&(args->args[i]), sizeof(int), UNLINKAT_FLAG_T);
            break;
        }
    }

    return 0;
}

The code snippet is the definition of the save_args_to_buffer function. This function is responsible for saving the arguments (args) to the buffer.

Here’s a breakdown of what the code does:

  1. It checks if the types value is zero. If it is, it returns 0 indicating that there are no arguments to save.
  2. It obtains a pointer to the buffer of type bufs_t by calling the get_buffer function with DATA_BUF_TYPE as the argument. If the buffer pointer is NULL, it returns 0 indicating a failure.
  3. It then iterates over the arguments using a loop. Inside the loop, it switches on the argument type determined by DEC_ARG_TYPE(i, types) where i is the current iteration index. Based on the argument type, different actions are taken:
  • For argument types such as INT_T, OPEN_FLAGS_T, PTRACE_REQ_T, MOUNT_FLAG_T, UMOUNT_FLAG_T, SOCK_DOM_T, SOCK_TYPE_T, and UNLINKAT_FLAG_T, it calls the save_to_buffer function to save the argument value to the buffer with the corresponding size and type.
  • For FILE_TYPE_T and STR_T, it calls the save_file_to_buffer and save_str_to_buffer functions respectively to save the argument values to the buffer.
  • For SOCKADDR_T, it checks the address family and based on the family value, it saves the appropriate struct sockaddr data to the buffer.
  • After iterating over all the arguments, it returns 0 indicating a successful save.
  • Overall, the save_args_to_buffer function is responsible for saving the arguments to the buffer based on their types.

17.Here’s a brief explanation of these lines:

events_perf_submit(ctx);
static __always_inline int events_perf_submit(struct pt_regs *ctx)
{
    bufs_t *bufs_p = get_buffer(DATA_BUF_TYPE);
    if (bufs_p == NULL)
        return -1;

    u32 *off = get_buffer_offset(DATA_BUF_TYPE);
    if (off == NULL)
        return -1;

    void *data = bufs_p->buf;
    int size = *off & (MAX_BUFFER_SIZE - 1);

    return bpf_perf_event_output(ctx, &sys_events, BPF_F_CURRENT_CPU, data, size);
}

The code is the implementation of the events_perf_submit function. This function is responsible for submitting events to a BPF perf event output buffer.

Here’s a breakdown of the code:

  1. bufs_t *bufs_p = get_buffer(DATA_BUF_TYPE);: It retrieves a pointer to the buffer of type DATA_BUF_TYPE using the get_buffer function. If the buffer is not found or is NULL, it returns -1.

  2. u32 *off = get_buffer_offset(DATA_BUF_TYPE);: It retrieves the offset value for the DATA_BUF_TYPE buffer using the get_buffer_offset function. If the offset is not found or is NULL, it returns -1.

  3. void *data = bufs_p->buf;: It assigns the starting address of the buffer to the data pointer.

  4. int size = *off & (MAX_BUFFER_SIZE - 1);: It calculates the size of the data in the buffer by masking the offset value with MAX_BUFFER_SIZE - 1. This ensures that the size is within the maximum buffer size.

  5. return bpf_perf_event_output(ctx, &sys_events, BPF_F_CURRENT_CPU, data, size);: It submits the event to the BPF perf event output buffer using the bpf_perf_event_output function. The ctx parameter is a pointer to struct pt_regs, &sys_events is the BPF map representing the perf event output buffer, BPF_F_CURRENT_CPU specifies the CPU to submit the event to, data is the pointer to the data buffer, and size is the size of the data. The function returns the result of the submission.

Overall, the events_perf_submit function retrieves the buffer and offset, prepares the data and size, and then submits the event to the perf event output buffer.

Hello World!

Info

Here is the github link to the code. hello_world-demo

Our ebpf program is depended on few header files. Run the following commands to move them to your current project location.

bpftool btf dump file /sys/kernel/btf/vmlinux format c > headers/vmlinux.h

This header file provides defintions for data types, data structures and other kernel related information. In other terms it is called as dumping BTF(BPF Type Format) of the kernel

cp /usr/include/bpf/bpf_helpers.h headers/bpf_helpers.h && 
cp /usr/include/bpf/bpf_helper_defs.h headers/bpf_helper_defs.h

This header file provides defintions for linux ABI’s and also provides definitions for the different types of helper functions that are available.

User space and kernel space part

//go:build ignore

#include "vmlinux.h"
#include "bpf_helpers.h"

SEC("tp/syscalls/sys_enter_execve")
void execve(){
   bpf_printk("Hello World! I am triggered by enter point of execve.");
};

char _license[] SEC("license") = "Dual MIT/GPL";

This is our kernel space program. This program will get triggered every time execve syscall was invoked.

package main

//go:generate go run github.com/cilium/ebpf/cmd/bpf2go -cc clang -cflags $BPF_CFLAGS bpf index.bpf.c -- -I./headers

import (
"fmt"

"github.com/cilium/ebpf/link"
)

func main() {
ebpfObj := bpfObjects{}
err := loadBpfObjects(&ebpfObj, nil)
if err != nil {
 panic(err)
}
defer ebpfObj.Close()

hook, err := link.Tracepoint("syscalls", "sys_enter_execve", ebpfObj.Execve, nil)
if err != nil {
 panic(err)
}
defer hook.Close()

fmt.Println("Waiting for event to trigger!")

for {
}
}

This our user space program. This program loads and attaches the ebpf program to the hook and wait for it till we terminate the program.

Compilation

To compile this program we are the following the way defined by cilium/ebpf.

//go:generate go run github.com/cilium/ebpf/cmd/bpf2go -cc clang -cflags $BPF_CFLAGS bpf index.bpf.c -- -I./headers

This line is responsible for compling the kernel space code. It will also generate big endian and little endian version based go files which provides the definition for bpfObjects and loadBpfObjects.

go generate

This triggers the above line it then complies the kernel space code and generates the defintion for ebpf objects.

go generate
go build -o demo

This builds the code and generates the executable with name demo.

go build

Execution

sudo ./demo
run

Output

In order to see the print statements we need to move to /sys/kernel/debug/tracing directory. Run the following command.

 cat trace_pipe | grep -i hello
output

Hello World!

Info

Here is the github link to the code. hello_world-demo

Our ebpf program is depended on few header files. Run the following commands to move them to your current project location.

bpftool btf dump file /sys/kernel/btf/vmlinux format c > headers/vmlinux.h

This header file provides defintions for data types, data structures and other kernel related information. In other terms it is called as dumping BTF(BPF Type Format) of the kernel

cp /usr/include/bpf/bpf_helpers.h headers/bpf_helpers.h && 
cp /usr/include/bpf/bpf_helper_defs.h headers/bpf_helper_defs.h

This header file provides defintions for linux ABI’s and also provides definitions for the different types of helper functions that are available.

User space and kernel space part

//go:build ignore

#include "vmlinux.h"
#include "bpf_helpers.h"

SEC("tp/syscalls/sys_enter_execve")
void execve(){
   bpf_printk("Hello World! I am triggered by enter point of execve.");
};

char _license[] SEC("license") = "Dual MIT/GPL";

This is our kernel space program. This program will get triggered every time execve syscall was invoked.

package main

//go:generate go run github.com/cilium/ebpf/cmd/bpf2go -cc clang -cflags $BPF_CFLAGS bpf index.bpf.c -- -I./headers

import (
"fmt"

"github.com/cilium/ebpf/link"
)

func main() {
ebpfObj := bpfObjects{}
err := loadBpfObjects(&ebpfObj, nil)
if err != nil {
 panic(err)
}
defer ebpfObj.Close()

hook, err := link.Tracepoint("syscalls", "sys_enter_execve", ebpfObj.Execve, nil)
if err != nil {
 panic(err)
}
defer hook.Close()

fmt.Println("Waiting for event to trigger!")

for {
}
}

This our user space program. This program loads and attaches the ebpf program to the hook and wait for it till we terminate the program.

Compilation

To compile this program we are the following the way defined by cilium/ebpf.

//go:generate go run github.com/cilium/ebpf/cmd/bpf2go -cc clang -cflags $BPF_CFLAGS bpf index.bpf.c -- -I./headers

This line is responsible for compling the kernel space code. It will also generate big endian and little endian version based go files which provides the definition for bpfObjects and loadBpfObjects.

go generate

This triggers the above line it then complies the kernel space code and generates the defintion for ebpf objects.

go generate
go build -o demo

This builds the code and generates the executable with name demo. go build

Execution

sudo ./demo
run

Output

In order to see the print statements we need to move to /sys/kernel/debug/tracing directory. Run the following command.

 cat trace_pipe | grep -i hello
output

Learn ZenML

Run ZenML Pipeline

So far we have seen,

1. How to setup your local machine to use ZenML 
2. What are the components of ZenML.
3. How to create ZenML Steps and Pipelines. 
4. How to register different stacks to the registry and activate them to use for our project.

Now, Let’s see what are some of the things that you need to keep in mind when converting your ML project into different Steps and Pipeine.

  1. You can probably create a step for each function within your ML model but commonly we try to group functions that do a certain task as a step. A common template to follow would be build a step for each stage of your model building. For example,
  • Data Ingestion
  • Data Processing
  • Data Splitting
  • Model Training
  • Model Evaluation
  • Model Development
  • Monitor Model Performance
  1. Each step should be considered as its very own process that reads and writes its inputs and outputs from and to the artifact store. This is where materializers comes into play.
  2. A materializer dictates how a given artifact can be written to and retrieved from the artifact store. It contains all serialization and deserialization logic. You can know more about the materializers from here .
  3. Step and pipeline configurations are used to dynamically set parameters at runtime. It is a good practice to configure from the CLI and a YAML config:

Do this when you want to launch pipeline runs without modifying the code at all. This is most useful in production scenarios. Learn more from here .

  1. You can create a separate step_filename.py for each step you like to use in your pipeline, especially if you want to create common steps that can be used across different pipelines.
  2. Repeat the same for materializers and store them as materializer_filename.py
  3. Now you can import any step and materializer that you want and create a pipeline using them. Save it as zenml_pipeline_filename.py
  4. Congrats!!! You are now all set to run your first pipeline.
python zenml_pipeline_filename.py [-c] [path/to/your/config_file.py]  

Yes it is as simple as that.

Configuration

Global site parameters

On top of Hugo global configuration , Dot lets you define the following parameters in your config.toml (here, values are default).

Note that some of these parameters are explained in details in other sections of this documentation.

# base URL place here
baseURL = "https://examplesite.com"
# this is your site title
title = "Hugo documentation theme"
# theme should be `godocs`
theme = "godocs"
# disable language from here
disableLanguages = ["fr"] # now franch language is disabled


# add css plugin
[[params.plugins.css]]
link = "define plugins path"

# add js plugin
[[params.plugins.js]]
link = "define plugins path"


# main menu
[[menu.main]]
name = "contact"
url = "contact/"
weight = 1

# Call to action is default enabled, if you want to disable it. just change the 
enable = false

####### Default parameters ###########
[params]
logo = "images/logo.png"
# Meta data
description = "This is meta description"
author = "Themefisher"
# contact form action
contact_form_action = "#" # contact form works with https://formspree.io

Routing

Cras at dolor eget urna varius faucibus tempus in elit. Cras a dui imperdiet, tempus metus quis, pharetra turpis. Phasellus at massa sit amet ante semper fermentum sed eget lectus. Quisque id dictum magna turpis.

Etiam vestibulum risus vel arcu elementum eleifend. Cras at dolor eget urna varius faucibus tempus in elit. Cras a dui imperdiet

Etiam vestibulum risus vel arcu elementum eleifend. Cras at dolor eget urna varius faucibus tempus in elit. Cras a dui imperdiet, tempus metus quis, pharetra turpis. Phasellus at massa sit amet ante semper fermentum sed eget lectus. Quisque id dictum magna, et dapibus turpis.Etiam vestibulum risus vel arcu elementum eleifend. Cras at dolor eget urna varius faucibus tempus in elit. Cras a dui imperdiet, tempus metus quis, pharetra turpis. Phasellus at massa sit amet ante semper fermentum sed eget lectus. Quisque id dictum magna, et dapibus turpis.

Use Case of Temporal with Traefik and Python FastAPI

Tekton Task Image build

Build Dockerfile

This Tekton task builds a Docker image using Buildah, providing the necessary parameters for customization.

Parameters

  • IMAGE: Reference of the image that Buildah will produce.
  • BUILDER_IMAGE: The location of the Buildah builder image.
    • Default: quay.io/buildah/stable:v1.29.1
  • STORAGE_DRIVER: Set the Buildah storage driver.
    • Default: vfs
  • DOCKERFILE: Path to the Dockerfile to build.
    • Default: ./Dockerfile
  • CONTEXT: Path to the directory to use as the build context.
    • Default: src
  • FORMAT: The format of the built container, either oci or docker.
    • Default: docker

Workspaces

  • source: Workspace containing the source code.
  • dockerconfig (Optional):
    • An optional workspace that allows providing a .docker/config.json file for Buildah to access the container registry.
    • The file should be placed at the root of the Workspace with the name config.json.

Steps

Build

This step executes the build process using Buildah.

set -x
pwd 
ls -ltr
buildah --storage-driver=$(params.STORAGE_DRIVER) bud \
  --format=$(params.FORMAT) \
  --no-cache \
  -f $(params.DOCKERFILE) -t $(params.IMAGE)

rm -rf "target/images"
mkdir -p "target/images"
buildah push \
  --storage-driver=$(params.STORAGE_DRIVER) \
  --format docker \
  $(params.IMAGE) \
  docker-archive:target/images/docker-image-local.tar
ls -al target/images

The script begins by setting up the environment, then initiates the build process with Buildah. After the build, it manages the resulting image and stores it in the desired format and location.

Security Context: This step requires privileged access.

Terraform scan using terrascan

Enhance Your Terraform Security with Terrascan

As the adoption of Infrastructure as Code (IaC) continues to rise, ensuring the security and compliance of your infrastructure templates becomes paramount. This is where Terrascan comes into play. Terrascan is an open-source tool that provides static code analysis for your IaC, helping you identify security risks, compliance violations, and best practice issues. In this blog post, we’ll explore what Terrascan is, why it’s crucial for your IaC projects, and how you can start using it to bolster your infrastructure security.

What is Terrascan?

Terrascan is a static code analyzer designed specifically for IaC written in HashiCorp Configuration Language (HCL). It scans your Terraform code for potential security vulnerabilities, compliance violations, and adherence to best practices. Terrascan supports various cloud providers including AWS, Azure, Google Cloud, and Kubernetes.

Why Use Terrascan?

1. Security First Approach

Terrascan helps you proactively identify security risks in your infrastructure code. It scans for misconfigurations and potential vulnerabilities before they can be exploited.

2. Compliance Assurance

For organizations subject to compliance requirements, Terrascan ensures that your infrastructure code adheres to industry-specific standards. It checks for compliance with frameworks like CIS, NIST, and HIPAA.

3. Best Practice Adherence

Terrascan enforces best practices for IaC development. It identifies areas where your code can be optimized for performance, maintainability, and readability.

4. Easy Integration

Terrascan can be seamlessly integrated into your CI/CD pipeline. This allows you to automate the scanning process and catch issues early in the development lifecycle.

Getting Started with Terrascan

Installation

Getting started with Terrascan is straightforward. Begin by downloading the latest release for your platform from the official GitHub repository . Once downloaded, add the Terrascan binary to your system’s PATH.

Scanning Your Terraform Code

To scan your Terraform code, navigate to the directory containing your Terraform files and run the following command:

terrascan scan

Integrating Terrascan into Your Workflow

CI/CD Pipeline Integration

To automate security checks in your CI/CD pipeline, incorporate Terrascan into your existing workflow. This can be done by adding a Terrascan scan step before deploying your infrastructure.

# Example tekton task configuration
apiVersion: tekton.dev/v1beta1
kind: ClusterTask
metadata:
  name: terrascan-task
spec:
  params:
    - name: BASE_IMAGE
      description: The base image for the task
      type: string
      default: tenable/terrascan:latest
    - name: terrascan_format
      type: string
      default: json
    - name: terrascan_outputs
      type: string
      default: terrascan_results.json
    - name: IAC_DIR
      type: string
      default: "terraform"
  workspaces:
    - name: source
  steps:
    - name: terrascan
      image: $(params.BASE_IMAGE)
      workingDir: $(workspaces.source.path)      
      script: |    
        terrascan scan -o $(params.terrascan_format) -d $(params.IAC_DIR) | tee -a $(params.terrascan_outputs)
        cat $(params.terrascan_outputs)
# Example .gitlab-ci.yml configuration

stages:
  - scan
  - deploy

terrascan_scan:
  stage: scan
  script:
    - terrascan scan
  only:
    - merge_requests

In this example, we’ve added a terrascan_scan job to our Tekton/GitLab CI/CD pipeline. This job executes the terrascan scan command, which scans our Terraform code for potential security issues. The job is triggered only for merge requests.

You can observe the output as follows:

Defaulted container "step-terrascan" out of: step-terrascan, prepare (init), place-scripts (init), working-dir-initializer (init)
{
  "results": {
    "scan_errors": [
      {
        "iac_type": "arm",
        "directory": "/workspace/source/terraform",
        "errMsg": "ARM files not found in the directory /workspace/source/terraform"
      },
      {
        "iac_type": "docker",
        "directory": "/workspace/source/terraform",
        "errMsg": "Dockerfile not found in the directory /workspace/source/terraform"
      }
    ],
    "violations": [
      {
        "rule_name": "unrestrictedIngressAccess",
        "description": "Ensure no security groups allow ingress from 0.0.0.0/0 to ALL ports and protocols",
        "rule_id": "AC_AWS_0231",
        "severity": "HIGH",
        "category": "Infrastructure Security",
        "resource_name": "testvm",
        "resource_type": "aws_security_group",
        "module_name": "root",
        "file": "main.tf",
        "plan_root": "./",
        "line": 53
      }
    ]
{
  "results": {
    "scan_errors": [
      {
        "iac_type": "arm",
        "directory": "/workspace/source/terraform",
        "errMsg": "ARM files not found in the directory /workspace/source/terraform"
      }
    ]
   }
}                      

By integrating Terrascan into your CI/CD pipeline, you can ensure that your infrastructure code is continuously validated for security and compliance.

Conclusion

Terrascan is a valuable addition to your Infrastructure as Code (IaC) toolkit. By providing static code analysis tailored for Terraform, it empowers teams to proactively identify security risks, compliance violations, and best practice issues in their infrastructure code.

With features like custom policies, remote execution, and multi-cloud support, Terrascan offers flexibility and extensibility to meet the specific needs of your organization.


Note: Always refer to the official Terrascan documentation for the latest information and best practices.

Card

Cards - Are mainly used to display details about a single topic - can be actions or just content. Cards should be relevant actionable information. For example if you want to show you companies sales in numbers you can use a card to highlight it in a better way. Mainly used on:

  • Homepages
  • Dashboards

Import

import Card, {StatsCard,} from '@intelops/intelops_ui/packages/react/components/Card/src';

Create a Card

<Card
  className="w-full"
  title="IntelOps"
  titleHref="https://capten.ai/"
  caption="Trusted By Fast Growing Brands And Enterprises. Be The Captain."
  body="Website is under active development.
  Our products are currently in Stealth mode development.
  Building the Next-Gen Tech For Cloud-Native.
  Ai-based framework to democratize Cloud Native Technology."
  imageURL="https://capten.ai/images/banner/homepage/homepage-banner.svg"
  buttonName="Select"
/>

Props

NameTypeDescription
idstringUnique to each element can be used to lookup an element getElementById( )
classNamestringTo add new or to override the applied styles
imageURLstringTo access images directly with a link instead of downloading them
imageAltstringIncase the original image does not work you can add a different link or some text in its place
titlestringcards title
titleHrefstringTo add url to the title - to navigate to another page onClick
captionstringdescription/ caption on the card
bodystringcontent of the card
buttonNamestringAdd button name to specify it’s action onClick

Create a Stats Card

<StatsCard
  amount="50,000"
  title="Users"
  percentageChange="40%"
  icon= {[<ChartPieIcon color="white" />]}
/>

Props

NameTypeDescription
idstringUnique to each element can be used to lookup an element getElementById( )
classNamestringTo add new or to override the applied styles
amountstringThe number or the information main highlighted text
titlestringTitle of the stats card
percentageChangestringThe percentage or information- highlighted text on the side
iconnodeicon on the card

Contributing to the UI template

Since this template is for internal usage, we can always try and add things that you think might be a useful addition to the existing UI template. How can you do that?

Step 1: First you’ll have to get access to the GitHub repo - you need permissions to access the repo without permissions you won’t be able to see the name of the template repo.

Step 2: Clone the ui-templates-common-repo to your local.

Step 3: Once your clone is complete you should be able to see intelops-common-ui in the node modules.

Step 4: Do npm install to get he latest package into the node_modules. You need to check the file structure and try to make your components in the same structure. This will help maintain the consistency of the code.

Step 5: Create your component - you can also follow the sample Creating your own components .

Note: Always try to create re-usable react components that is try not to hard code anything.

Step 6: Now that you have your component ready - raise a PR to the develop branch of ui-templates-common-repo .

Once your code is reviewed by the admin - they’ll merge it into the branch.

Troubleshooting Storybook: Fixing Issues in Node.js Projects

Storybook.js

If you are looking at this Im guessing you already know what storybook is, but just to refresh everyone’s memory : Storybook is an open-source development tool for building reusable UI components in isolation(away from the application or any framework). We can ot only develop but also test our components in isolation. Also allows better documentation and collaboration.

Running Storybook.js

Once you have your application with atleast a few working components, you just have to install and run storybook. I thought I’ll be able to test all my react components but had quite a few issues. I had to go through 8-9 stackoverflow and github pages to finally find one solution that actually worked for me so just wanted to state all of them in one place just in case someone else also faces the same issues.

npm start
//or 
npm run storybook

Issues:

Okay, so you cloned a repo… will it start working as soon as you run? The answer is almost always NO. The first thing to check is for node modules (if you are using react frameworks). Don’t have node_modules just install using:

Issue 1: Missing node_modules

npm install

Run storybook.

Now in an ideal case your application would work perfectly but in my case it did not: there were some errors from my npm install. So I tried npm install --force. I still had issues so I tried npm audit -fix --force. This lead to the application not recognizing storybook.js completely. The error looked something like this:

Issue 2: Storybook command not found/ Node version conflict

npm ERR! Failed at the redux-todomvc-example@0.0.0 storybook script 'start-storybook -p 9001'edux-todomvc-example@0.0.0 storybook /Users/Desktop/sample/storybooksample 
> start-storybook -p 9001 

sh: start-storybook: command not found 

This can happen if there is a “node version conflict”, one of the obvious solutions was to downgrade my node version from v.20.x to v.16.x, but I did not want to do that - why? one there is a chance that this may crash your other projects that were built on new version and the other being why would you want to move backwards. So, I just tried uninstalling node modules and reinstalling them:

//uninstalling node_modules
rm -rf node_modules
//reinstalling 
npm install 

And thankfully it worked. If you don’t want to do this you can always move down node version, I personally don’t like doing that so I chose this method.

Then we have yet another issue.

Issue 3: Storybook-addons error

I tried running storybook again and yes, you guessed it a third error:

error3

In this case removing @storybook/addon-actions from addons array should solve this error – you can just comment it out.

This brings us to the last error that I got.

Issue 4: OpenSSL unsupported

It looked something like this:

error4

If you carefully look at the end of the error you can see ERR_OSSL_EVP_UNSUPPORTED

Now this happens because up until Node v17.x OpenSSL v2 was used. OpenSSL is used by NodeJS for hash functionality code. Version 3 of OpenSSL disables MD4 which is why node.js is broken in the latest node versions.
That being said there are multiple ways to solve this issue :

  • One way is to try and update your start script in package.json to use
react-scripts --openssl-legacy-provider start 
  • If that doesn’t work try:
//In linux
export NODE_OPTIONS=--openssl-legacy-provider
//In windows - just replace the export with “set” 
set NODE_OPTIONS=--openssl-legacy-provider

If you are lucky this might be the end of the issues, but then I wasn’t so a new issue popped up - now I had a conflict with the webpack versions. And the error looked something like this: error5

Check your package.json file you probably must be using the latest version of webpack and a older version of storybook, if that is the case - then all you have to do is upgrade your storybook version.

npx storybook upgrade

Finally now if you try to do npm start storybook or npm run storybook - you will be able to see storybook up and running.

Conclusion

I tried to cover all the issue that I faced, and since you reached till here, I am guessing that your issues also got solved, hopefully. That being said storybook.js is a great way to test your components so don’t let the errors stop you from using it.

Getting Started

Note: This entire document is only for internal team usage.

Installation

Install IntelOps UI for your design needs.

Note: You can see the template in Intelops UI private repo

Package Prerequisites

Note: Since this is a private repo, just installing using npm won’t download the packages, we need to follow a few more steps - adding GitHub PATs to your VScode.

How to add GitHub Personal Access Tokens to your VsCode

To install the published UI packages into your code:

  1. Create a .npmrc file inside the root directory of the Intelops UI private repo
  2. Add the below two lines in the npmrc file
    • registry=https://npm.pkg.github.com
    • auth_token={Personal access token generated using intelops private github account}
  3. Now add the below line in package.json file under dependencies
    • “@intelops/intelops_ui”: “1.0.3”

Dependencies

"Dependencies":{
"@intelops/intelops_ui": "1.0.3"
}

After adding the .npmrc file before installation run :

npm login

This will ask for your :

  • Username: {github username}
  • Password: {personal access token that you’ve added in your .npmrc file}

Now you ready to start your installation.

Installation

Now to install the package, run one of the following commands in your project:

npm

npm install @intelops/intelops_ui@1.0.3

yarn

yarn add @intelops/intelops_ui@latest --registry=https://npm.pkg.github.com

After installation make sure to check if the latest version of the common ui package has been installed under node_modules folder.

eBPF Program

Writing an eBPF Program Using Ringbuf Map with libbpfgo

In this blog post, we will explore how to write an eBPF (extended Berkeley Packet Filter) program that utilizes a ringbuf map to transfer data. We will also learn how to process the data stored in the ringbuf map using libbpfgo, a Go library for interacting with eBPF programs.

Introduction to Ringbuf Map

A ringbuf map is a type of map provided by eBPF that allows efficient transfer of data between eBPF programs and user space. It is particularly useful for scenarios where you need to push data, such as packet samples, from an eBPF program to a daemon running in user space.

Writing the eBPF Code

To use the ringbuf map in an eBPF program, we follow these main steps:

Define a BPF_MAP_TYPE_RINGBUF map

We declare a ringbuf map with a specified maximum number of entries.

/* BPF ringbuf map */
struct {
        __uint(type, BPF_MAP_TYPE_RINGBUF);
        __uint(max_entries, 256 * 1024 /* 256 KB */);
} events SEC(".maps");

Reserve memory space and write data

Before writing data, we need to apply for memory space using the bpf_ringbuf_reserve function. It is important to ensure the application for memory space is successful before writing data; otherwise, the program execution may fail with an error.

SEC("kprobe/do_sys_openat2")
int kprobe__do_sys_openat2(struct pt_regs *ctx)
{
    struct event *e;

    e = bp*f_ringbuf_reserve(&events, sizeof(*e), 0);
    if (!e) {
        return 0;
    }

    e->pid = bpf_get_current_pid_tgid() >> 32;

    bpf_ringbuf_submit(e, 0);

    return 0;
}

In the above example, we reserve memory space for an event structure, set the pid field of the event, and submit it to the ringbuf map using the bpf_ringbuf_submit function.

Using libbpfgo to Process Data from the Ringbuf Map

To process the data stored in the ringbuf map using libbpfgo, we can follow these steps:

Initialize the ringbuf map data receiver

We use the InitRingBuf method provided by libbpfgo to initialize a ringbuf map data receiving instance. This method takes the name of the map and a channel where the data will be sent.


eventsChannel := make(chan []byte)
pb, err := bpfModule.InitRingBuf("events", eventsChannel)
if err != nil {
    panic(err)
}

Start the instance: We start the initialized instance using the Start method.


pb.Start()
defer func() {
    pb.Stop()
    pb.Close()
}()

Receive and decode data

We continuously receive data from the channel and decode it according to the expected format.

for {
    select {
    case e := <-eventsChannel:
        // decode data: u32 pid
        pid := binary.LittleEndian.Uint32(e[0:4])
        log.Printf("pid %d", pid)
    }
}

In the above code snippet, we receive a byte slice from the eventsChannel and decode it by extracting the pid field using the binary.LittleEndian.Uint32 function.

Conclusion


In this blog post, we explored how to write an eBPF program that utilizes a ringbuf map for data transfer

Defining-Dashboard-Components

Let’s an example of what that library might look like

  • Define the library namespace
local mydashboard = {};
  • Define a function for creating a new dashboard
mydashboard.dashboard = (title, panels) => {
  {
    title: title,
    panels: panels,
  }
};
  • Define a function for creating a new row
mydashboard.row = (panels) => {
  {
    panels: panels,
  }
};
  • Define a function for creating a new panel
mydashboard.panel = (title, datasource, charttype, xaxis, yaxis) => {
  {
    title: title,
    datasource: datasource,
    charttype: charttype,
    xaxis: xaxis,
    yaxis: yaxis,
  }
};
  • Define some example data sources
local datasources = {
  data1: "http://myapp/data1",
  data2: "http://myapp/data2",
};
  • Define an example dashboard using the library functions
local mydashboardconfig = mydashboard.dashboard("My Dashboard", [
  mydashboard.row([
    mydashboard.panel("Panel 1", datasources.data1, "bar", "x", "y"),
    mydashboard.panel("Panel 2", datasources.data2, "line", "x", "y"),
  ]),
]);
  • Print the resulting JSON configuration
std.manifestJsonnet(mydashboardconfig)

In this example, we define a mydashboard library namespace that contains functions for creating a dashboard, row, and panel. We also define an example set of data sources and use the library functions to create a dashboard configuration with two panels, one displaying a bar chart and the other displaying a line chart.

To use this library in your application, you can load the library into your Jsonnet code and call the library functions to generate the appropriate JSON configuration for your dashboard. You can also extend the library with additional functions and objects to support more advanced dashboard features, such as custom styling, event handlers, and user interactions.

Monitoring and Observability

SysFlow

What is XDP

eBPF (extended Berkeley Packet Filter) XDP (Express Data Path) programs are a type of eBPF program that are attached to a network interface using the XDP hook. The XDP hook is a low-level hook that allows eBPF programs to be executed early in the packet receive path, before the packet is passed up the network stack.

XDP programs can be used to perform various packet processing tasks, such as filtering, forwarding, modifying, or collecting statistics on network traffic. Because they execute in the kernel, they have access to low-level network metadata and can be used to implement advanced networking features that would otherwise require kernel modifications.

The XDP hook (eXpress Data Path) is a hook in the Linux kernel that allows for packet processing at the earliest possible stage in the networking stack. It provides a low-level interface to packet filtering and manipulation, and is often used for high-performance network processing.

XDP programs are written in C and compiled into eBPF bytecode using the LLVM compiler. The eBPF bytecode is then loaded into the kernel using the bpf system call. Once loaded, the XDP program can be attached to a network interface.

XDP programs can be used to implement a variety of network functions, including:

  1. Packet filtering: XDP programs can be used to selectively drop or allow packets based on various criteria, such as source/destination addresses or protocols.
  2. Load balancing: XDP programs can be used to distribute incoming traffic across multiple network interfaces or backend servers.
  3. Traffic monitoring: XDP programs can be used to collect statistics or logs on incoming network traffic.

Customization

GoDocs has been built to be as configurable as possible.

In config.toml you will find a logo variable. you can change your logo there.

logo = "images/logo.png"

Tip

The size of the logo will adapt automatically

Change the favicon

If your favicon is a png, just drop off your image in your local static/images/ folder and name it favicon.png

If you need to change this default behavior, create a new file in layouts/partials/ named head.html. Then write something like this:

<link rel="shortcut icon" href="/images/favicon.png" type="image/x-icon" />

Change default colors

GoDocs support change color. You can change the colors from assets/scss/variables.scss. You can change the colors of the template as you want.

/* Color Variables */
$primary-color: #FF0043;
$text-color: #333;
$text-color-dark: #222;
$text-color-light: #999;
$body-color: #fff;
$border-color: #E2E2E2;
$black: #FEF2EB;
$white: #fff;
$light: #FBFBFB;

/* Font Variables */
$font-primary: 'Montserrat', sans-serif;
$icon-font: 'themify';

Ubuntu

Cras at dolor eget urna varius faucibus tempus in elit. Cras a dui imperdiet, tempus metus quis, pharetra turpis. Phasellus at massa sit amet ante semper fermentum sed eget lectus. Quisque id dictum magna turpis.

Etiam vestibulum risus vel arcu elementum eleifend. Cras at dolor eget urna varius faucibus tempus in elit. Cras a dui imperdiet

Etiam vestibulum risus vel arcu elementum eleifend. Cras at dolor eget urna varius faucibus tempus in elit. Cras a dui imperdiet, tempus metus quis, pharetra turpis. Phasellus at massa sit amet ante semper fermentum sed eget lectus. Quisque id dictum magna, et dapibus turpis.Etiam vestibulum risus vel arcu elementum eleifend. Cras at dolor eget urna varius faucibus tempus in elit. Cras a dui imperdiet, tempus metus quis, pharetra turpis. Phasellus at massa sit amet ante semper fermentum sed eget lectus. Quisque id dictum magna, et dapibus turpis.

Checkov

Tekton Task Image Push

Build and Push

This Tekton task builds a container image using Buildah and pushes it to a container registry.

Parameters

  • IMAGE: Reference of the image Buildah will produce.
  • BUILDER_IMAGE: The location of the Buildah builder image.
    • Default: quay.io/buildah/stable:v1.29.1
  • STORAGE_DRIVER: Set the Buildah storage driver.
    • Default: vfs
  • DOCKERFILE: Path to the Dockerfile to build.
    • Default: ./Dockerfile
  • CONTEXT: Path to the directory to use as context.
    • Default: src
  • FORMAT: The format of the built container, oci or docker.
    • Default: “docker”

Workspaces

  • source
  • dockerconfig: An optional workspace that allows providing a .docker/config.json file for Buildah to access the container registry. The file should be placed at the root of the Workspace with the name config.json.

Results

  • IMAGE_DIGEST: Digest of the image just built.
  • IMAGE_URL: Image repository where the built image would be pushed to.

Steps

build

This step performs the build and push process.

#!/usr/bin/env sh
set -x
ls -al target/images/

buildah --storage-driver=$(params.STORAGE_DRIVER) images

buildah --storage-driver=$(params.STORAGE_DRIVER) pull docker-archive:target/images/docker-image-local.tar

buildah --storage-driver=$(params.STORAGE_DRIVER) images  

buildah --storage-driver=$(params.STORAGE_DRIVER) push \
  --authfile /workspace/dockerconfig/config.json \
  --digestfile /tmp/image-digest $(params.IMAGE) \
  docker://$(params.IMAGE)
  
cat /tmp/image-digest | tee $(results.IMAGE_DIGEST.path)
echo -n "$(params.IMAGE)" | tee $(results.IMAGE_URL.path)

It uses Buildah commands to pull the built image, and finally, it pushes the image to the specified container registry. The resulting image digest and repository URL are saved as task results.

How-to-guides

In case you want to create new components or contribute to the template.

Learn

New to IntelOps UI? You can get started with the help of this video tutorial.

Create your own sample with the help of IntelOps UI components. Once you install the UI template, you can start using its components by importing each into your main file.

NOTE: All the components and the required code in available in the components section.

Step 1: Since this is a sample page, let us first import all 18 components that we are going to use first.

import React, { useState } from "react";
import Alert from "@intelops/intelops_ui/packages/react/components/Alert/src"; 
import Avatar from "@intelops/intelops_ui/packages/react/components/Avatar/src";
import Button from "@intelops/intelops_ui/packages/react/components/Button/src";
import Card, {StatsCard,} from "@intelops/intelops_ui/packages/react/components/Card/src";
import Checkbox from "@intelops/intelops_ui/packages/react/components/Checkbox/src";
import Chip from "@intelops/intelops_ui/packages/react/components/Chip/src";
import Collapse from "@intelops/intelops_ui/packages/react/components/Collapse/src";
import Dropdown from "@intelops/intelops_ui/packages/react/components/Dropdown/src";
import Modal from "@intelops/intelops_ui/packages/react/components/Modal/src";
import Navbar from "@intelops/intelops_ui/packages/react/components/Navbar/src";
import Progress from "@intelops/intelops_ui/packages/react/components/Progress/src";
import SwitchButton from "@intelops/intelops_ui/packages/react/components/Switch/src";
import Tab from "@intelops/intelops_ui/packages/react/components/Tab/src";
import Table from "@intelops/intelops_ui/packages/react/components/Table/src";
import Textarea from "@intelops/intelops_ui/packages/react/components/Textarea/src";
import TextField from "@intelops/intelops_ui/packages/react/components/TextField/src";
import Tooltip from "@intelops/intelops_ui/packages/react/components/Tooltip/src";
import Typography from "@intelops/intelops_ui/packages/react/components/Typography/src";

Step 2: Now add your code - render each component

import {
  ChartPieIcon,
  UserGroupIcon,
  ServerIcon,
} from "@heroicons/react/solid";

export default function IntelopsUI() {
  const handleButtonClick = () => {
    alert("button clicked");
  };
  const handleChange = () => {
    setChecked(!checked);
  };
  const [tableData, setTableData] = useState(tableDetails);
  return (
    <div className="z-10 w-full max-w-5xl items-center justify-between font-mono text-sm">

    {/* Avatar Component */}

      <Avatar
        src="https://avatars.githubusercontent.com/u/91454231?s=280&v=4"
        alt="intelops logo"
        variant="circle"
        className="avatar"
        size="xlarge"
      >
        Intelops
      </Avatar>

      {/* Typography Component */}

      <Typography 
        variant="h3"
      >
        Sample Application
      </Typography>

      <main className="relative flex min-h-screen flex-col items-center justify-between p-24">

      {/* Navbar Component */}

        <Navbar 
            className="navbar" />

        {/* Alert Component */}

        <Alert 
            variant="fuchsia" 
            className="alert"
        >
          This is a Sample Page
        </Alert>

        {/* Tab Component */}

        <Tab
          tabDetails={[
            {
              id: 1,
              label: "App",
              url: "#",
              icon: <ChartPieIcon className="w-6 h-6" color="slate" />,
            },
            {
              id: 2,
              label: "Messages",
              url: "#",
              icon: <UserGroupIcon className="w-6 h-6" color="slate" />,
            },
            {
              id: 3,
              label: "Settings",
              url: "#",
              icon: <ServerIcon className="w-6 h-6" color="slate" />,
            },
          ]}
        />

        <div class="w-full flex flex-wrap p-6 mx-auto">
          <div class="w-full max-w-full px-3 shrink-0 md:flex-0 md:w-6/12">

          {/* Chip Component */}

        <Chip 
            title="chip" 
            variant="fuchsia"
        >
            Form Testing
        </Chip>

        {/* Progress Component */}

        <Progress
            className="progress"
            variant="orange"
            progressPercentage="50"
        />
        <form
            action="https://getform.io/f/328f984c-0601-4562-9e10-eb209ee508f3"
            method="POST"
            encType="multipart/form-data"
        >
        <div className="grid md:grid-cols-2 gap-4 w-full py-2">
        <div className="flex flex-col">
        <label className="uppercase text-sm py-2">Name</label>

        {/* TextField Component */}

        <TextField
            variant="default"
            placeholder="Enter Name"
            name="textarea name"
            required="true"
        />
        </div>
        </div>
        <div className="flex flex-col py-2">
        <label className="uppercase text-sm py-2">Email</label>

        {/* TextField Component */}

        <TextField
            variant="default"
            placeholder="Enter Email"
            name="textarea email"
            required="true"
        />
        </div>
        <div className="flex flex-col py-2">
        <label className="uppercase text-sm py-2">Message</label>

        {/* Textarea Component */}

        <Textarea
            rows="6"
            placeholder="Type in your message"
            name="textarea name"
        />
        </div>
        <div className="flex flex-col py-2">

        {/* Checkbox Component */}

        <Checkbox 
            type="checkbox" 
            onChange={handleChange}
        >
            Do you want to select
        </Checkbox>
        
        {/* Switch Component */}

        <SwitchButton 
            className="switch"
            disabled 
        >
            Select
        </SwitchButton>
        </div>

        {/* Button Component */}

        <Button
            variant="outlined"
            className="mybutton"
            size="medium"
            color="orange"
            onClick={handleButtonClick}
        >
            Send Message
        </Button>

        </form>
        </div>
        <div class="w-full max-w-full px-3 shrink-0 md:flex-0 md:w-6/12">

        {/* Card Component */}

        <Card
            className="w-full"
            title="IntelOps"
            titleHref="https://capten.ai/"
            caption="Trusted By Fast Growing Brands And Enterprises. Be The Captain."
            body="Website is under active development.
                    Our products are currently in Stealth mode development.
                    Building the Next-Gen Tech For Cloud-Native.
                    Ai-based framework to democratize Cloud Native Technology."
            imageURL="https://capten.ai/images/banner/homepage/homepage-banner.svg"
            buttonName="Select"
        />
        </div>

        <StatsCard
            amount="50,000"
            title="Users"
            percentageChange="40%"
            icon={[<ChartPieIcon color="white" />]}
        />
        </div>

        {/* Dropdown Component */}

        <Dropdown
          title="Dropdown"
          content={[
            {
              id: 1,
              option: "Action",
              value: "",
              href: "",
            },
            {
              id: 2,
              option: "Another action",
              value: "",
              href: "",
            },
            {
              id: 3,
              option: "Something else here",
              value: "",
              href: "",
            },
          ]}
          onChange={handleChange}
        />
        {/* Modal Component */}

        <Modal
          header="Modal Testing"
          modalExit={true}
          content="Conent Here"
          footer={true}
        />

        {/* Table Component */}

        <Table
          columns={[
            { Header: "Author", accessor: "autorName" },
            { Header: "Role", accessor: "rolename" },
            { Header: "Status", accessor: "status" },
            { Header: "Employed", accessor: "employed" },
            { Header: "Actions", accessor: "actions" },
          ]}
          tableData={[
            {
              autorName: "Austin",
              rolename: "Manager",
              status: "Online",
              employed: "23/04/18",
              actions: "Edit", 
            },
            {
              autorName: "Max",
              rolename: "Developer",
              status: "Offline",
              employed: "23/04/18",
              actions: "Edit",
            },
            {
              autorName: "TJ",
              rolename: "Developer",
              status: "Online",
              employed: "23/04/18",
              actions: "Edit",
            },
            {
              autorName: "Stuart",
              rolename: "Developer",
              status: "Online",
              employed: "23/04/18",
              actions: "Edit",
            },
          ]}
        />
      </main>
    </div>
  );
}

Step 3: Now run the application

npm run dev

Learn DevOps

Tools and libraries

Interacting with Linux BPF Ring Buffer using Package ringbuf in libbpfgo

Introduction

Linux BPF (Berkeley Packet Filter) ring buffer is a powerful mechanism that allows userspace programs to interact with custom events submitted by BPF programs. These events can be essential for tasks such as pushing packet samples from BPF to user space daemons. In this blog post, we will explore how the package ringbuf in libbpfgo enables seamless interaction with the Linux BPF ring buffer.

Understanding the Package ringbuf

The package ringbuf provides a convenient API for reading bpf_ringbuf_output from user space. It offers functionality to create a reader, read records from the ring buffer, set deadlines, and manage resources. Let’s take a closer look at the key components of this package.

Reader

The Reader struct is the central component of the package ringbuf. It encapsulates the functionality required to read records from the BPF ring buffer. The NewReader function is used to create a new instance of the Reader by providing the corresponding ring buffer map.

type Reader struct {
    // contains filtered or unexported fields
}

func NewReader(ringbufMap *ebpf.Map) (*Reader, error)

Reading Records

The Read method of the Reader allows us to read the next record from the BPF ring buffer. It returns a Record object containing the raw sample data. If the Close method is called on the reader, the Read method will return os.ErrClosed Additionally, if a deadline was set and it expires, the Read method will return os.ErrDeadlineExceeded.

func (r *Reader) Read() (Record, error)

Efficient Record Reading

To improve efficiency and reduce memory allocations, the package provides the ReadInto method, introduced in version 0.9.0. This method allows us to reuse a preallocated Record object and its associated buffers, minimizing unnecessary memory operations.

func (r *Reader) ReadInto(rec *Record) error

Setting Deadlines

The SetDeadline method, added in version 0.9.2, enables the control of the blocking behavior of the Read and ReadInto methods. By passing a specific time value, we can set a deadline for waiting on samples. A zero time.Time value removes the deadline.

func (r *Reader) SetDeadline(t time.Time)

Closing the Reader

To free the resources used by the reader, the Close method is available. It interrupts any ongoing calls to the Read method and releases associated resources.

func (r *Reader) Close() error

Conclusion


The package ringbuf in libbpfgo simplifies the interaction with the Linux BPF ring buffer, enabling userspace programs to read custom events submitted by BPF programs efficiently. With its intuitive API, developers can easily create a reader, read records from the ring buffer, set deadlines for blocking calls, and manage resources effectively. By leveraging the capabilities of the package ringbuf, users can harness the full potential of the BPF ring buffer in their applications.

The package ringbuf documentation and examples provide further insights into its usage and integration with libbpfgo. With this powerful tool at your disposal, you can unlock the full potential of BPF ring buffer interactions in your Linux applications.

Learn Next.js

Kernel Space eBPF program for XDP hook

//go:build ignore

This is a build constraint for Go. It specifies that this file should be ignored by the Go build system.

#include "bpf_endian.h"
#include "common.h"

Header files that provide some utility functions and macros that are used in the program defined in the Cilium eBPF library.

  1. bpf_endian.h: This header file defines macros for converting between host and network byte order. It is used to ensure that the program works correctly on different endianness architectures (either big-endian or little-endian).
  2. common.h: This header file contains common definitions and macros used by the program, such as the Ethernet protocol (ETH_P_IP),XDP pass/fail return codes (XDP_PASS and XDP_DROP), including macro definitions for BPF_MAP_TYPE_LRU_HASH
char __license[] SEC("license") = "Dual MIT/GPL";

This specifies the license for the program.

This line declares a character array named __license and assigns it a value of "Dual MIT/GPL". The SEC("license") attribute attached to the declaration is used by the eBPF verifier to place this data into a specific section of the eBPF object file. In this case, the license section.

Note : In Linux kernel programming and eBPF programming, the __license variable is used to specify the license under which the code is distributed. The Linux kernel is distributed under the GNU GPL license, but some parts of it may be licensed under other open source licenses, such as the MIT license. This line is used to indicate that the eBPF code in question is dual-licensed under both the MIT and GPL licenses.

#define MAX_MAP_ENTRIES 16

This defines the maximum number of entries that the LRU hash map can hold.

/* Define an LRU hash map for storing packet count by source IPv4 address */
struct {
	__uint(type, BPF_MAP_TYPE_LRU_HASH);
	__uint(max_entries, MAX_MAP_ENTRIES);
	__type(key, __u32);   // source IPv4 address
	__type(value, __u32); // packet count
} xdp_stats_map SEC(".maps");

This is defining an LRU hash map data structure called xdp_stats_map that will be stored in the maps section of the compiled BPF program.

The following configuration attributes are needed when creating the eBPF map:

union bpf_attr {
 struct { /* anonymous struct used by BPF_MAP_CREATE command */
        __u32   map_type;       /* one of enum bpf_map_type */
        __u32   key_size;       /* size of key in bytes */
        __u32   value_size;     /* size of value in bytes */
        __u32   max_entries;    /* max number of entries in a map */
        __u32   map_flags;      /* prealloc or not */
 };
}

struct { ... } xdp_stats_map - Defines a structure named xdp_stats_map.

  1. __uint(type, BPF_MAP_TYPE_LRU_HASH); - Sets the type field of the structure to BPF_MAP_TYPE_LRU_HASH, indicating that this is a hash map with least-recently-used eviction policy.
  2. __uint(max_entries, MAX_MAP_ENTRIES); - Sets the max_entries field of the structure to the maximum number of entries that the hash map can hold. MAX_MAP_ENTRIES is a preprocessor macro that is defined elsewhere in the program.
  3. __type(key, __u32); - Sets the key field of the structure to the data type used as the key in the hash map. In this case, it’s a 32-bit unsigned integer (__u32) representing the source IPv4 address.
  4. __type(value, __u32); - Sets the value field of the structure to the data type used as the value in the hash map. In this case, it’s also a 32-bit unsigned integer (__u32) representing the packet count.
  5. SEC(".maps") - Sets the section in which the xdp_stats_map structure will be stored when the BPF program is compiled. In this case, it will be stored in the maps section, which is reserved for BPF maps.

Learn more about different types of eBPF maps and how to create them

SEC("xdp")

This is a C macro that tells the eBPF compiler that this function should be compiled as an XDP program. xdp is the name of the section where this program will be loaded.

int xdp_prog_func(struct xdp_md *ctx) {

This is the definition of the XDP program. It takes a single argument struct xdp_md *ctx which contains metadata about the received packet. The parameter struct xdp_md *ctx is a pointer to a metadata structure that contains information about the incoming packet that the XDP program is processing. This metadata structure, xdp_md, is defined in the /include/uapi/linux/bpf.h header file and contains various fields, such as pointers to the start and end of the packet data, the incoming interface index, and the packet’s hardware headers.

struct xdp_md {
	__u32 data;
	__u32 data_end;
	__u32 data_meta;
	/* Below access go through struct xdp_rxq_info */
	__u32 ingress_ifindex; /* rxq->dev->ifindex */
	__u32 rx_queue_index;  /* rxq->queue_index  */

	__u32 egress_ifindex;  /* txq->dev->ifindex */
};

The XDP program is a program that runs in the kernel space of the operating system and is executed when an incoming packet is received by the network interface card. The XDP program processes the packet, and then either forwards it to the next network stack layer, or drops it.

	__u32 ip;
	if (!parse_ip_src_addr(ctx, &ip)) {
		// Not an IPv4 packet, so don't count it.
		goto done;
	}

This block of code attempts to parse the source IP address from the received packet using the parse_ip_src_addr function. If the function returns 0, it means that the packet is not an IPv4 packet, so the program skips to the end of the function using a goto statement.

__u32 *pkt_count = bpf_map_lookup_elem(&xdp_stats_map, &ip);
if (!pkt_count) {
	// No entry in the map for this IP address yet, so set the initial value to 1.
	__u32 init_pkt_count = 1;
	bpf_map_update_elem(&xdp_stats_map, &ip, &init_pkt_count, BPF_ANY);
} else {
	// Entry already exists for this IP address,
	// so increment it atomically using an LLVM built-in.
	__sync_fetch_and_add(pkt_count, 1);
}
  1. If the packet is an IPv4 packet, this block of code uses the bpf_map_lookup_elem function to look up the packet count for the source IP address in the xdp_stats_map hash map.
  2. If there is no entry in the map for the IP address, the program inserts a new entry with an initial packet count of 1 using the bpf_map_update_elem function.
  3. If there is already an entry in the map for the IP address, the program increments the packet count atomically using the __sync_fetch_and_add built-in function.
done:
	// Try changing this to XDP_DROP and see what happens!
	return XDP_PASS;
}

This block of code is the end of the XDP program. If the packet is not an IPv4 packet, the program jumps to the done label and returns XDP_PASS, indicating that the packet should be passed through to the next program in the chain. If the packet is an IPv4 packet, the program increments the packet count and also returns XDP_PASS. By default, XDP_PASS indicates that the packet should be passed through to the next program in the chain, it can be changed to XDP_DROP to drop the packet.

Windows

Cras at dolor eget urna varius faucibus tempus in elit. Cras a dui imperdiet, tempus metus quis, pharetra turpis. Phasellus at massa sit amet ante semper fermentum sed eget lectus. Quisque id dictum magna turpis.

Etiam vestibulum risus vel arcu elementum eleifend. Cras at dolor eget urna varius faucibus tempus in elit. Cras a dui imperdiet

Etiam vestibulum risus vel arcu elementum eleifend. Cras at dolor eget urna varius faucibus tempus in elit. Cras a dui imperdiet, tempus metus quis, pharetra turpis. Phasellus at massa sit amet ante semper fermentum sed eget lectus. Quisque id dictum magna, et dapibus turpis.Etiam vestibulum risus vel arcu elementum eleifend. Cras at dolor eget urna varius faucibus tempus in elit. Cras a dui imperdiet, tempus metus quis, pharetra turpis. Phasellus at massa sit amet ante semper fermentum sed eget lectus. Quisque id dictum magna, et dapibus turpis.

Tekton Task Trivy-Scanning

Trivy Scanner

This Tekton task uses Trivy, a comprehensive scanner for vulnerabilities in container images, file systems, and Git repositories, as well as for configuration issues. It scans for vulnerabilities in the source code in standalone mode.

Parameters

  • ARGS: The arguments to be passed to the Trivy command.
  • TRIVY_IMAGE: Trivy scanner image to be used.
    • Default: docker.io/aquasec/trivy@sha256:dea76d4b50c75125cada676a87ac23de2b7ba4374752c6f908253c3b839201d9
  • IMAGE_PATH: Image or path to be scanned by Trivy.
  • EXIT_CODE: Define the exit code if severity vulnerabilities are found.

Workspaces

  • manifest-dir

Steps

trivy-scan

This step runs the Trivy scanner on the specified image or path.

#!/usr/bin/env sh
ls -al
pwd
ls -al /workspaces
ls -al target/images
cmd="trivy image --input target/images/docker-image-local.tar --format json"
# cmd="trivy $* /tmp/trivy_scanner_image.tar"
echo "Running trivy task with command below"
echo "$cmd"
eval "$cmd"
echo "result of above command $?"
trivy image --severity CRITICAL --input target/images/docker-image-local.tar --exit-code $(params.EXIT_CODE)
if [[ $? == 1 ]]
then
  echo "find critical vulns"
  exit 1
else
  echo "no critical vulns"
fi

It then constructs and executes the Trivy command to scan the specified image. If critical vulnerabilities are found, the task exits with an error code.

Terragrunt

Mastering Infrastructure Management with Terragrunt

Terraform has revolutionized infrastructure as code, but as your projects grow, managing multiple configurations can become challenging. Enter Terragrunt - a powerful wrapper for Terraform that adds essential features and simplifies the management of complex infrastructure deployments. In this blog post, we’ll explore what Terragrunt is, why it’s indispensable, and how you can harness its capabilities to streamline your Terraform workflows.

Introducing Terragrunt

Terragrunt is a thin wrapper for Terraform that extends its capabilities. It provides additional features, best practices, and simplifications to help manage multiple Terraform configurations more effectively.

Key Features

1. Remote State Management

Terragrunt facilitates seamless remote state management, automatically configuring backends like Amazon S3, Google Cloud Storage, and more. This ensures secure and reliable storage of your Terraform state files.

2. DRY Principles

Terragrunt follows the DRY (Don’t Repeat Yourself) principle. It supports modularization, allowing you to define common configurations in modules and avoid redundancy across multiple Terraform configurations.

3. State File Locking

Terragrunt automates state file locking, preventing concurrent modifications and potential race conditions. This safeguards the integrity of your infrastructure deployments.

4. Environment Management

Managing multiple environments (e.g., dev, staging, prod) is simplified with Terragrunt. It enables you to define shared configurations and override them as needed for specific environments, ensuring consistency and minimizing manual effort.

5. Dependency Handling

Terragrunt intelligently manages module dependencies, ensuring they are applied in the correct order. This eliminates the need for manual intervention in complex dependency scenarios.

6. Input Variable Configuration

Terragrunt provides a seamless way to pass input variables to your Terraform configurations. This makes it easy to reuse modules and customize deployments for specific use cases.

7. CI/CD Integration

Terragrunt seamlessly integrates into CI/CD pipelines, enabling automated infrastructure deployments. This ensures a consistent and reliable deployment process, especially in fast-paced development environments.

Getting Started with Terragrunt

Installation

To get started with Terragrunt, visit the official GitHub repository at https://github.com/gruntwork-io/terragrunt for installation instructions.

Using Terragrunt

1. terragrunt init

The terragrunt init command initializes a Terraform configuration, setting up the directory for use with Terraform. It installs any required modules and configures the backend for remote state management. This command is crucial for preparing your environment for Terraform operations.

2. terragrunt plan

The terragrunt plan command generates an execution plan for your infrastructure changes. It provides valuable insights into what actions will be taken by Terraform to achieve the desired state. This helps you review and verify changes before applying them.

3. terragrunt apply

With terragrunt apply, you can apply the planned changes to your infrastructure. This command creates, modifies, or deletes resources as necessary to align with your desired state. It’s a pivotal step in the deployment process.

4. terragrunt destroy

The terragrunt destroy command is used to tear down resources managed by Terraform. It removes all resources created by Terraform in the associated configuration. This command is particularly useful for cleaning up resources after they are no longer needed.

5. terragrunt run-all

The terragrunt run-all command allows you to execute a Terraform command against multiple configurations within subfolders. This is extremely useful when you have a complex project with multiple modules or environments to manage.

6. terragrunt hclfmt

terragrunt hclfmt is used for formatting HCL (HashiCorp Configuration Language) files. It recursively finds HCL files and rewrites them into a canonical format. This helps maintain consistent and readable code across your project.

7. terragrunt graph-dependencies

The terragrunt graph-dependencies command provides a visual representation of the dependency graph between your Terragrunt modules. It helps you understand the relationships between different components in your infrastructure.

Conclusion

Terragrunt is a game-changer for Terraform users managing complex infrastructure projects. Its additional features and best practices simplify the management of multiple configurations, ensuring consistency and reliability in your deployments.


Note: Always ensure you have the latest version of Terragrunt and refer to the official documentation for the most up-to-date information and best practices.

Checkbox

Checkboxes - are used for input control, which allows us to select items from a group. Checkboxes are usually used in:

  • Lists when you have to select one or more items.
  • To show lists with sub-sections.
  • To represent if something is on/off.

Note: Incase you want to show a single option, its better to use a switch than a checkbox because its sometimes easier to miss a single checkbox.

Import

import Checkbox from '@intelops/intelops_ui/packages/react/components/Checkbox/src';

Create a Checkbox

<Checkbox 
    type="checkbox" 
    onChange={handleChange}>
    Checkbox Name
</Checkbox>

Props

NameTypeDescription
idstringUnique to each element can be used to lookup an element getElementById( )
classNamestringTo add new or to override the applied styles
childrennodeComponents content
typestringValid HTML5 input value
namestringtitle of the textarea
onChangefunctionTo handle change - when you enter data

Components

Dive

Userspace program

Major components you might find in this userspace eBPF program written using the Cilium eBPF library in Go are as follows:

  1. Loading pre-compiled eBPF programs into the kernel
  2. Attaching the eBPF program to a network interface using XDP (eXpress Data Path)
  3. Printing the contents of the BPF hash map (source IP address -> packet count) to stdout every second using a ticker.
  4. A helper function formatMapContents() to format the contents of the BPF hash map as a string.
  5. Error handling for all potential errors, such as failing to load the eBPF program or failing to attach it to the network interface.

package main

import (
	"fmt"
	"log"
	"net"
	"os"
	"strings"
	"time"

	"github.com/cilium/ebpf"
	"github.com/cilium/ebpf/link"
)

Import statements for required Go packages and the Cilium eBPF library and link package.


// $BPF_CLANG and $BPF_CFLAGS are set by the Makefile.
//go:generate go run github.com/cilium/ebpf/cmd/bpf2go -cc $BPF_CLANG -cflags $BPF_CFLAGS bpf xdp.c -- -I../headers

This part of the code generates Go code that includes the compiled eBPF program as an embedded byte array, which is then used in the main Go program without relying on external files.

  1. The comment indicates following line is a Go generate directive, genertaes Go code that includes the compiled eBPF program, defined in the C source file xdp.c, as an embedded byte array.
  2. The $BPF_CLANG and $BPF_CFLAGS environment variables are used as parameters for the command, and they are expected to be set by the Makefile.
  3. These environment variables specify the C compiler and its flags to use when compiling the eBPF program.
func main() {
	if len(os.Args) < 2 {
		log.Fatalf("Please specify a network interface")
	}

	// Look up the network interface by name.
	ifaceName := os.Args[1]
	iface, err := net.InterfaceByName(ifaceName)
	if err != nil {
		log.Fatalf("lookup network iface %q: %s", ifaceName, err)
	}

We check that the user has provided a command-line argument specifying the network interface to attach the XDP program to. If not, the program exits with a fatal error message.

We use the network interface name specified by the user to look up the corresponding interface object using the net.InterfaceByName() function. If the lookup fails, the program exits with a fatal error message.

	// Load pre-compiled programs into the kernel.
	objs := bpfObjects{}
	if err := loadBpfObjects(&objs, nil); err != nil {
		log.Fatalf("loading objects: %s", err)
	}
	defer objs.Close()

This creates an empty bpfObjects struct and then loads pre-compiled eBPF programs into the kernel using the loadBpfObjects() function.

  1. If the load fails, the program exits with a fatal error message.
  2. If the load succeeds, a defer statement is used to ensure that the Close() method of the bpfObjects struct is called at the end of the function, regardless of whether it returns normally or with an error.
	// Attach the program.
	l, err := link.AttachXDP(link.XDPOptions{
		Program:   objs.XdpProgFunc,
		Interface: iface.Index,
	})
	if err != nil {
		log.Fatalf("could not attach XDP program: %s", err)
	}
	defer l.Close()
	
	log.Printf("Attached XDP program to iface %q (index %d)", iface.Name, iface.Index)
	log.Printf("Press Ctrl-C to exit and remove the program")

link.AttachXDP() attaches the XDP program to the specified network interface. It returns a handle to the XDP program that can be used to detach it later.

  1. The function takes an XDPOptions struct that specifies the program and the network interface. objs.XdpProgFunc is the eBPF program’s entry point function.
  2. Definiton of XDPOptions struct
type XDPOptions struct {
	// Program must be an XDP BPF program.
	Program *ebpf.Program

	// Interface is the interface index to attach program to.
	Interface int

	// Flags is one of XDPAttachFlags (optional).
	//
	// Only one XDP mode should be set, without flag defaults
	// to driver/generic mode (best effort).
	Flags XDPAttachFlags
}

If an error occurs while attaching the XDP program, the program exits with a fatal error message.defer l.Close() defers the closing of the XDP program handle until the end of the function.

	// Print the contents of the BPF hash map (source IP address -> packet count).
	ticker := time.NewTicker(1 * time.Second)
	defer ticker.Stop()
	for range ticker.C {
		s, err := formatMapContents(objs.XdpStatsMap)
		if err != nil {
			log.Printf("Error reading map: %s", err)
			continue
		}
		log.Printf("Map contents:\n%s", s)
	}
}

This code prints the contents of the BPF hash map to the console every second using a ticker.

  1. time.NewTicker(1 * time.Second) creates a ticker that will send a message every second.
  2. defer ticker.Stop() defers the stopping of the ticker until the end of the function.
  3. The for range ticker.C loop receives messages from the ticker channel.
  4. formatMapContents() takes the eBPF map and returns a formatted string of the map’s contents.If there is an error reading the map, the error message is printed to the console, and the loop continues.
func formatMapContents(m *ebpf.Map) (string, error) {
	var (
		sb  strings.Builder
		key []byte
		val uint32
	)
	iter := m.Iterate()
	for iter.Next(&key, &val) {
		sourceIP := net.IP(key) // IPv4 source address in network byte order.
		packetCount := val
		sb.WriteString(fmt.Sprintf("\t%s => %d\n", sourceIP, packetCount))
	}
	return sb.String(), iter.Err()

This takes an eBPF map as input, iterates over the key-value pairs in the map, and returns a string representation of the map’s contents. Here’s what each line of the function does:

func formatMapContents(m *ebpf.Map) (string, error) { defines the function with a parameter m representing the eBPF map to be formatted and a return type of a string and an error.

  1. var ( defines multiple variables in a single line.

  2. sb strings.Builder declares a strings.Builder variable named sb. This variable is used to build up the formatted string.

  3. key []byte declares a []byte variable named key. This variable is used to store the key of the current key-value pair during iteration.

  4. val uint32 declares a uint32 variable named val. This variable is used to store the value of the current key-value pair during iteration.

  5. iter := m.Iterate() creates a new iterator for the given eBPF map m. The Iterate method returns an iterator object which is used to iterate over the map’s key-value pairs.

  6. for iter.Next(&key, &val) { starts a loop that iterates over the map’s key-value pairs.

  7. The Next method of the iterator object returns true if there are more key-value pairs to be iterated over, and assigns the current key and value to the variables passed as pointers to it.

  8. sourceIP := net.IP(key) converts the []byte key into an net.IP object representing the IPv4 source address in network byte order. This is necessary because the eBPF map stores IP addresses as byte arrays.

  9. packetCount := val stores the value of the current key-value pair in the packetCount variable.

  10. sb.WriteString(fmt.Sprintf("\t%s => %d\n", sourceIP, packetCount)) formats the current key-value pair as a string and writes it to the sb string builder.

  11. return sb.String(), iter.Err() returns the final string representation of the eBPF map’s contents as well as any error that occurred during iteration.

  12. The String method of the strings.Builder object returns the built string, and the Err method of the iterator object returns any error that occurred during iteration.

Learn gRPC

FluentBit

Tekton Task Trivy-SBOM

Trivy Scanner with SBOM Generation and ClickHouse Storage

This Tekton task integrates Trivy for vulnerability scanning, generates a Software Bill of Materials (SBOM) in SPDX format, and stores the SBOM in ClickHouse database.

Parameters

  • TRIVY_IMAGE: Trivy scanner image to be used.
    • Default: docker.io/aquasec/trivy:0.44.0
  • IMAGE: Image or Path to be scanned by Trivy.
    • Default: alpine
  • DIGEST: SHA256 Digest of the image.
    • Default: “sha256:567898ytrfkj9876trtyujko9876tghjioiuyhgfb”
  • format: Format for the generated SBOM (e.g., spdx-json).
    • Default: spdx-json

Workspaces

  • manifest-dir
  • clickhouse
  • python-clickhouse

Results

  • IMAGE_SBOM: SBOM of the image just built.

Steps

trivy-sboms

This step runs Trivy to scan the provided image, generates an SBOM in SPDX format, and saves it to sbom.json.

#!/usr/bin/env sh
cmd="trivy image --format $(params.format) --output spdx.json --input target/images/docker-image-local.tar"
echo "Running trivy task with command below"
echo "$cmd"
eval "$cmd"
echo "result of above command $?"
trivy sbom ./spdx.json > sbom.json

clickhouse-client

This step interacts with the ClickHouse database to store the generated SBOM.

#!/usr/bin/env sh
ls -al
export CLICKHOUSE_HOST=`cat /workspace/clickhouse/host`
export port=`cat /workspace/clickhouse/port`
export CLICKHOUSE_USER=`cat /workspace/clickhouse/user`
export CLICKHOUSE_PASSWORD=`cat /workspace/clickhouse/password`
cat /workspace/python-clickhouse/clickhouse.py > clickhouse.py
cat clickhouse.py
cat ${SBOM_FILE_PATH}
python clickhouse.py

The script retrieves necessary environment variables for ClickHouse connection, prepares the ClickHouse client script, and executes it to store the SBOM.

Please ensure the necessary ClickHouse configurations are provided in the workspaces (clickhouse and python-clickhouse) before running this task.

Terraspace

Simplify Your Infrastructure Deployment with Terraspace

In the realm of Infrastructure as Code (IaC), streamlining the deployment process and managing complex cloud infrastructures can be a daunting task. Enter Terraspace, a powerful framework designed to simplify and enhance your Terraform workflows. In this blog post, we’ll dive into what Terraspace is, its key features, and how it can revolutionize your infrastructure deployment.

What is Terraspace?

Terraspace is an open-source framework that acts as a wrapper for Terraform, providing a more intuitive and efficient way to manage your infrastructure code. It enhances the development experience by adding functionalities such as modularity, environment management, and simplified deployments. Terraspace takes care of the boilerplate code, allowing you to focus on writing the actual infrastructure logic.

Key Features of Terraspace

1. Modularity and Reusability

Terraspace encourages a modular approach to infrastructure code. It allows you to break down your code into smaller, manageable components, making it easier to maintain and reuse across projects. This modularity promotes best practices like DRY (Don’t Repeat Yourself) and ensures consistency in your infrastructure.

2. Environment Management

Managing multiple environments (such as development, staging, and production) can be challenging. Terraspace simplifies this process by providing a clean separation between different environments. You can define environment-specific configurations and variables, allowing for seamless transitions between environments.

3. Built-in Testing Framework

Terraspace comes with an integrated testing framework that enables you to write automated tests for your infrastructure code. This ensures that your deployments meet the expected outcomes and reduces the risk of errors in production.

4. Plugin Ecosystem

Terraspace supports plugins, allowing you to extend its functionality and integrate with other tools seamlessly. This extensibility makes it easy to incorporate additional features or customize your workflow to suit your specific needs.

Getting Started with Terraspace

Install: Ubuntu/Debian

This page shows you how to install Terraspace on Ubuntu and Debian based Linux systems that use the apt package manager.

Ubuntu/Debian: apt-get install

Configure repo
sudo su
echo "deb https://apt.boltops.com stable main" > /etc/apt/sources.list.d/boltops.list
curl -s https://apt.boltops.com/boltops-key.public | apt-key add -
Install
apt-get update
apt-get install -y terraspace
Remove
apt-get remove -y terraspace

Creating a Test Project

To get started with Terraspace, let’s create a new project. Use the following command to generate a basic structure for your project:

terraspace new demo

This command will create the necessary directories and files to kickstart your Terraspace project.

Working with Terraspace

1. Module Development

Start by creating modules within your Terraspace project. Each module represents a specific piece of infrastructure (e.g., a VPC, EC2 instance, or RDS database). Define the module’s configuration using Terraform HCL files.

2. Environment Configuration

Define environment-specific configurations in the config/env directory. This allows you to customize variables and settings for different environments.

3. Testing Your Infrastructure

Write automated tests for your infrastructure code using Terraspace’s testing framework. This ensures that your deployments meet the desired criteria and functionality.

4. Deployment

Deploy your infrastructure using Terraspace with a simple command:

terraspace up demo

Terraspace will handle the deployment process, managing the Terraform execution and providing detailed output.

Conclusion

Terraspace is a game-changer for managing and deploying cloud infrastructure with Terraform. Its modular approach, environment management capabilities, built-in testing framework, and plugin ecosystem make it a powerful tool in the IaC toolkit.

By adopting Terraspace, you can streamline your development process, improve code maintainability, and ensure a consistent and reliable infrastructure deployment pipeline.


Note: Always refer to the official Terraspace documentation for the latest information and best practices.

Chip

Chips - allows users to show information, make selections, to filter content or to trigger actions. How are they different from buttons? Buttons usually appear consistently along with a action attached to them, while chips usually appear dynamically as interactive elements. One of the most common use of chips is as:

  • Contact tags

Import

import Chip from '@intelops/intelops_ui/packages/react/components/Chip/src';

Create an Alert

<Chip 
    title = "chip"
    variant="orange">
    Text on the chip
</Chip>

Props

NameTypeDescription
idstringUnique to each element can be used to lookup an element getElementById( )
classNamestringTo add new or to override the applied styles
childrennodeComponents content
variantstringHas multiple colors - eight in total

Chip Variants

The variants in this case is that you can choose frm 8 different colors

Variants

  1. fuchsia
  2. slate
  3. lime
  4. red
  5. orange
  6. cyan
  7. gray
  8. dark

Plugins

Learn Visualization

Repository-Structure

$ebpf-network
|==go.mod
|==go.sum
|==Readme.md
|==headers
|--------bpf_endian.h
|--------bpf_helper_defs.h
|--------bpf_helpers.h
|--------bpf_tracing.h
|--------common.h
|--------update.sh
|===xdp
|--------bpf_bpfeb.go
|--------bpf_bpfeb.o
|--------bpf_bpfel.go
|--------bpf_bpfel.o
|--------main.go
|________xdp.c   

go.mod and go.sum

  • go.mod and go.sum are two files used by the Go programming language to manage dependencies of a project.

  • go.mod file defines the module’s dependencies and metadata, including the module’s name, version, and requirements for other modules.

  • It also includes the Go version that the module is compatible with. The go.mod file is created and updated using the go mod command-line tool.

  • go.sum file contains the expected cryptographic checksums of the modules that are required by the go.mod file. It helps to ensure the integrity and security of the dependencies, preventing unauthorized modifications. It is automatically generated and updated by Go modules when dependencies are downloaded.

Together, go.mod and go.sum provide a simple and reliable way to manage dependencies in Go projects, making it easy to share code with others and to keep track of updates and changes in dependencies.

Generate go.mod

To generate a go.mod file for a Go project, you can use the go mod init command followed by the name of your module.

For example, if your project is named “myproject”, you would run:

go mod init myproject

This will create a go.mod file in your project directory, which will contain the module name and any required dependencies.

Generate go.sum

Run the following command:

go mod tidy

This will update the go.sum file with the latest checksums for all the modules used in your project.

Learn Temporal

Kubescape

Tekton Task Image Signing

cosign-sign

This task is responsible for signing container images using Cosign.

Workspaces

  • source: The workspace containing the source code.
  • dockerconfig: An optional workspace that allows providing a .docker/config.json file for Buildah to access the container registry. The file should be placed at the root of the Workspace with the name config.json.
  • cosign: Cosign private key to sign the image.

Parameters

  • image: The image to be signed by Cosign.

Steps

cosign-sign

This step performs the actual signing process.

#!/usr/bin/env sh
mkdir -p ~/.docker/
export registry=`cat /workspace/dockerconfig/registry`
export username=`cat /workspace/dockerconfig/username`
export password=`cat /workspace/dockerconfig/password`
cosign login $registry -u $username -p $password
export COSIGN_PASSWORD=""
cosign sign -y --key /workspace/cosign/cosign.key $(params.image)

It extracts the registry, username, and password from the provided workspace and logs into the specified registry. Cosign login to registry and sign the Image and push the signing key to container registry.

How to run SASS in local and contritbuting to it

To run your SASS website in your local and making changes to it.

Running SASS website in your local

Once you have the required permissions - you should be able to see the repository in your github.

  • Create a folder > Clone your repository
  • Do npm install that way all the packages will be installed into your local.
  • Now you should be able to run the the application with:
npm run dev

Collapse

Collapse - is a accordion component allows users to show and hide sections of content on a page. Usually used to display:

  • Menus and Submenus
  • FAQs and so on

Import

import Collapse from '@intelops/intelops_ui/packages/react/components/Collapse/src';

Create a Collapse

<Collapse
    className= "collapse"
    summary= "Intelops Collapse"
    details= "the information in the collapse file">
</Collapse>

Props

NameTypeDescription
idstringUnique to each element can be used to lookup an element getElementById( )
classNamestringTo add new or to override the applied styles
summarystringTitle/ a glimpse of whats inside
detailsstringThe information on the component

ebpf library

Cilium is an open-source project that provides a networking and security solution for containerized applications that leverages eBPF technology. The Cilium eBPF library provides a Go interface to the eBPF subsystem, making it easier to write eBPF programs in Go.

The Cilium eBPF library is a Go library that provides abstractions over eBPF programs and maps, as well as helpers for loading and attaching eBPF programs to various hooks in the Linux kernel.

Refer Cilium ebpf repository

Refer ebpf Official Documentation

Architecture of library

graph RL Program --> ProgramSpec --> ELF btf.Spec --> ELF Map --> MapSpec --> ELF Links --> Map & Program ProgramSpec -.-> btf.Spec MapSpec -.-> btf.Spec subgraph Collection Program & Map end subgraph CollectionSpec ProgramSpec & MapSpec & btf.Spec end

Refer for architecture

Cilium ebpf project structure

$tree xdp
xdp
|----bpf_bpfeb.go
|----bpf_bpfeb.o
|----bpf_bpfel.go
|----bpf_bpfel.o
|----main.go
|____xdp.c    

0 directories,6 files

The ebpf program’s source code file,xdp.c in the diagram, is compiled using bpf2go, a code generation tool provided by cilium/ebpf. bpf2go uses the clang compiler to generate two ebpf bytecode files: “bpf_bpfeb.o” for big-endian and “bpf_bpfel.o” for little-endian systems. Additionally, bpf2go generates “bpf_bpfeb.go” or “bpf_bpfel.go” files based on the corresponding bytecode file. These go source files contain the ebpf program’s bytecode as binary data.

The “main.go” file is responsible for the user state of the ebpf program. Compiling “main.go” with either “bpf_bpfeb.go” or “bpf_bpfel.go” creates the final ebpf program.

Read more about bpf2go

Untitled-2023-03-22-2025

These files are part of the Cilium eBPF library and are used to compile, load and execute eBPF programs within the Cilium datapath.The two binary formats (bpfeb and bpfel) are used to represent eBPF bytecode in different endianness, depending on the target architecture.

  1. bpf_bpfeb.go and bpf_bpfeb.o are related to the big-endian eBPF (bpfeb) binary format. bpf_bpfeb.go is the Go language binding for the bpfeb binary format, while bpf_bpfeb.o is the actual binary file that contains the compiled eBPF bytecode in the bpfeb format.

  2. bpf_bpfel.go and bpf_bpfel.o are related to the little-endian eBPF (bpfel) binary format. bpf_bpfel.go is the Go language binding for the bpfel binary format, while bpf_bpfel.o is the actual binary file that contains the compiled eBPF bytecode in the bpfel format.

Headers

These are the headers provided by Cilium ebpf library.

  1. bpf_helpers.h: Defines helper functions provided by the kernel to eBPF programs, such as map lookup and modification, packet I/O operations, and synchronization primitives.
  2. bpf_endian.h: Provides conversion functions for different endianness of the data, as the eBPF program runs on a different endianness than the user space program.
  3. bpf_core_read.h: Provides functions for reading kernel data structures in eBPF programs, such as the sk_buff structure.
  4. bpf_core_write.h: Provides functions for writing to kernel data structures in eBPF programs, such as setting the return value of a system call.
  5. bpf_debug.h: Defines debugging helpers for eBPF programs, such as printing data and map contents.
  6. bpf_net_helpers.h: Provides helper functions for network-related tasks, such as TCP connection tracking and DNS lookup.
  7. bpf_time_helpers.h: Provides helper functions for timestamp and time conversion.

These headers are included in the Cilium eBPF library and can be used in eBPF C programs to interact with the kernel and perform various tasks.

Internal Guidelines

Quickwit

Tekton Task Image Sign Verify

cosign-image-verify

This task is responsible for verifying the signature of a container image using Cosign.

Description

This task uses Cosign to verify the signature of a container image.

Workspaces

  • source: The workspace containing the source code.
  • dockerconfig: An optional workspace that allows providing a .docker/config.json file for Buildah to access the container registry. The file should be placed at the root of the Workspace with the name config.json.
  • cosign: Cosign private key to verify the image signature.

Parameters

  • image: The image to be verified by Cosign.

Steps

cosign-sign

This step performs the actual verification process.

#!/usr/bin/env sh
mkdir -p ~/.docker/
export registry=`cat /workspace/dockerconfig/registry`
export username=`cat /workspace/dockerconfig/username`
export password=`cat /workspace/dockerconfig/password`
cosign login $registry -u $username -p $password
export COSIGN_PASSWORD=""
cosign verify --key /workspace/cosign/cosign.pub $(params.image)

It extracts the registry, username, and password from the provided workspace and logs into the specified registry.And it uses Cosign to verify the signature of the provided image using the specified public key.

Please ensure the necessary configurations are provided in the workspaces (dockerconfig and cosign) before running this task.

Devs

BPF Maps

eBPF maps are a generic data structure for storage of different data types.They allow sharing of data between eBPF kernel programs, and also between kernel and user-space applications. Using eBPF maps is a method to keep state between invocations of the eBPF program, and allows sharing data between eBPF kernel programs, and also between kernel and user-space applications.

Each map type has the following attributes:

   *  type

   *  maximum number of elements

   *  key size in bytes

   *  value size in bytes

It is defined in tools/lib/bpf/libbpf.c ,as a struct

struct bpf_map_def {
	unsigned int type;
	unsigned int key_size;
	unsigned int value_size;
	unsigned int max_entries;
	unsigned int map_flags;
};

Map type

Currently, the following values are supported for type defined at /usr/include/linux/bpf.h

enum bpf_map_type {
	BPF_MAP_TYPE_UNSPEC,
	BPF_MAP_TYPE_HASH,
	BPF_MAP_TYPE_ARRAY,
	BPF_MAP_TYPE_PROG_ARRAY,
	BPF_MAP_TYPE_PERF_EVENT_ARRAY,
	BPF_MAP_TYPE_PERCPU_HASH,
	BPF_MAP_TYPE_PERCPU_ARRAY,
	BPF_MAP_TYPE_STACK_TRACE,
	BPF_MAP_TYPE_CGROUP_ARRAY,
	BPF_MAP_TYPE_LRU_HASH,
	BPF_MAP_TYPE_LRU_PERCPU_HASH,
	BPF_MAP_TYPE_LPM_TRIE,
	BPF_MAP_TYPE_ARRAY_OF_MAPS,
	BPF_MAP_TYPE_HASH_OF_MAPS,
	BPF_MAP_TYPE_DEVMAP,
	BPF_MAP_TYPE_SOCKMAP,
	BPF_MAP_TYPE_CPUMAP,
	BPF_MAP_TYPE_XSKMAP,
	BPF_MAP_TYPE_SOCKHASH,
	BPF_MAP_TYPE_CGROUP_STORAGE_DEPRECATED,
	/* BPF_MAP_TYPE_CGROUP_STORAGE is available to bpf programs attaching
	 * to a cgroup. The newer BPF_MAP_TYPE_CGRP_STORAGE is available to
	 * both cgroup-attached and other progs and supports all functionality
	 * provided by BPF_MAP_TYPE_CGROUP_STORAGE. So mark
	 * BPF_MAP_TYPE_CGROUP_STORAGE deprecated.
	 */
	BPF_MAP_TYPE_CGROUP_STORAGE = BPF_MAP_TYPE_CGROUP_STORAGE_DEPRECATED,
	BPF_MAP_TYPE_REUSEPORT_SOCKARRAY,
	BPF_MAP_TYPE_PERCPU_CGROUP_STORAGE,
	BPF_MAP_TYPE_QUEUE,
	BPF_MAP_TYPE_STACK,
	BPF_MAP_TYPE_SK_STORAGE,
	BPF_MAP_TYPE_DEVMAP_HASH,
	BPF_MAP_TYPE_STRUCT_OPS,
	BPF_MAP_TYPE_RINGBUF,
	BPF_MAP_TYPE_INODE_STORAGE,
	BPF_MAP_TYPE_TASK_STORAGE,
	BPF_MAP_TYPE_BLOOM_FILTER,
	BPF_MAP_TYPE_USER_RINGBUF,
	BPF_MAP_TYPE_CGRP_STORAGE,
};

map_type selects one of the available map implementations in the kernel.For all map types, eBPF programs access maps with the same bpf_map_lookup_elem() and bpf_map_update_elem() helper functions.

Key Size

This field specifies the size of the key in the map, in bytes.

  1. The key is used to index the values stored in the map.
  2. The key can be a scalar type or a structure, but it must fit within the specified size.
  3. The sizeof(__u32) specifies the size of the map keys. In this case, the keys are 32-bit unsigned integers.

Value Size

This field specifies the size of the value in the map, in bytes.

  1. The value is the data that is stored in the map at each key.
  2. Like the key, the value can be a scalar type or a structure, but it must fit within the specified size.
  3. The sizeof(struct datarec) specifies the size of the map values.
  4. In this case, the values are structs of type struct datarec.

Max Entries

This field specifies the maximum number of entries that the map can hold.

  1. This is the maximum number of key-value pairs that can be stored in the map.
  2. This number is set at map creation time and cannot be changed later.
  3. In this case, the maximum number of entries is XDP_ACTION_MAX, which is a constant defined

Map flags

This field specifies additional flags that control the behavior of the map. For example, the BPF_F_NO_PREALLOC flag can be used to indicate that the kernel shouldgit not pre-allocate memory for the map, which can save memory in certain scenarios.

How-to-run-the-program

sudo -s
export BPF_CLANG=clang
go build

ip link is a command in Linux used to display and manage network interfaces. When used without any arguments, the ip link command displays a list of available network interfaces on the system along with their status, state, and hardware addresses

Here is an example output of the ip link command:

image

In this example, lo and wlp0s20f3 are the network interfaces on the system.

Run the following command, note the network interface in your system

ip link

Execute the program

./xdp wlp0s20f3 

Expected Output:

image

Tekton

Icons

Icons -

Import

import Icon from '@intelops/intelops_ui/packages/react/components/Icon/src';

Create a Icon

<Icon
    icon="ChartPieIcon"
    className="w-8 h-8"
    color="Orange"
    size="small"
/>

Props

NameTypeDescription
idstringUnique to each element can be used to lookup an element getElementById( )
iconstringName of the icon from the heroicons
childrennodeComponents content
classNametextTo add new or to override the applied styles
typetextthe type of button - can be given custom names and be used for grouping and styling
varianttextThe type of variant to use (all available button types in the table below)
colorstringTo change buttons color
Icon Color

Each icon has 8 colors to choose from:

  1. fushia
  2. slate
  3. lime
  4. red
  5. orange
  6. cyan
  7. gray
  8. darkGray
Icon Sizes

3 size options:

  • small
  • medium
  • large

Interacting With Maps

Interacting with eBPF maps happens through lookup/update/delete primitives.

Userspace

The userspace API map helpers for eBPF are defined in tools/lib/bpf/bpf.h and include the following functions:


/* Userspace helpers */
int bpf_map_lookup_elem(int fd, void *key, void *value);
int bpf_map_update_elem(int fd, void *key, void *value, __u64 flags);
int bpf_map_delete_elem(int fd, void *key);
/* Only userspace: */
int bpf_map_get_next_key(int fd, void *key, void *next_key);

To interact with an eBPF map from userspace, you use the bpf syscall and a file descriptor (fd). The fd serves as the map handle.On success, these functions return zero, while on failure they return -1 and set errno.

  • The wrappers for the bpf syscall are implemented in tools/lib/bpf/bpf.c and call functions in kernel/bpf/syscall.c , such as map_lookup_elem.

  • It’s worth noting that void *key and void *value are passed as void pointers. This is because of the memory separation between kernel and userspace, and it involves making a copy of the value. Kernel primitives like copy_from_user() and copy_to_user() are used for this purpose, as seen in map_lookup_elem , which also allocates and deallocates memory using kmalloc+kfree for a short period.

  • From userspace, there is no direct function call to increment or decrement the value in-place. Instead, the bpf_map_update_elem() call will overwrite the existing value with a copy of the value supplied. The overwrite operation depends on the map type and may happen atomically using locking mechanisms specific to the map type.

Kernel-side eBPF program

The eBPF program helpers for kernel-side interaction with maps are defined in the samples/bpf/bpf_helpers.h header file and are implemented in the kernel/bpf/helpers.c file via macros.

/* eBPF program helpers */
void *bpf_map_lookup_elem(void *map, void *key);
int bpf_map_update_elem(void *map, void *key, void *value, unsigned long long flags);
int bpf_map_delete_elem(void *map, void *key);

The bpf_map_lookup_elem() function is a kernel-side helper function that allows eBPF programs to directly access the value stored in a map by providing a pointer to the map and a pointer to the key.

  • Unlike the userspace API, which provides a copy of the value, the kernel-side API provides a direct pointer to the memory element inside the kernel where the value is stored.
  • This allows eBPF programs to perform atomic operations, such as incrementing or decrementing the value “in-place”, using appropriate compiler primitives like __sync_fetch_and_add(), which are understood by LLVM (Low-Level Virtual Machine) when generating eBPF instructions. -This direct access to the value memory element in the kernel provides more efficient and optimized access to map data structures for eBPF programs running in the kernel. So, the bpf_map_lookup_elem() function in the kernel-side eBPF API enables efficient and direct access to map values from eBPF programs running in the kernel.

Elements

Here is example of hedings. You can use this heading by following markdownify rules. For example: use # for heading 1 and use ###### for heading 6.

Heading 1

Heading 2

Heading 3

Heading 4

Heading 5
Heading 6

Emphasis

Emphasis, aka italics, with asterisks or underscores.

Strong emphasis, aka bold, with asterisks or underscores.

Combined emphasis with asterisks and underscores.

Strikethrough uses two tildes. Scratch this.


I’m an inline-style link

I’m an inline-style link with title

I’m a reference-style link

I’m a relative reference to a repository file

You can use numbers for reference-style link definitions

Or leave it empty and use the link text itself .

URLs and URLs in angle brackets will automatically get turned into links. http://www.example.com or http://www.example.com and sometimes example.com (but not on Github, for example).

Some text to show that the reference links can follow later.


Paragraph

Lorem ipsum dolor sit amet consectetur adipisicing elit. Quam nihil enim maxime corporis cumque totam aliquid nam sint inventore optio modi neque laborum officiis necessitatibus, facilis placeat pariatur! Voluptatem, sed harum pariatur adipisci voluptates voluptatum cumque, porro sint minima similique magni perferendis fuga! Optio vel ipsum excepturi tempore reiciendis id quidem? Vel in, doloribus debitis nesciunt fugit sequi magnam accusantium modi neque quis, vitae velit, pariatur harum autem a! Velit impedit atque maiores animi possimus asperiores natus repellendus excepturi sint architecto eligendi non, omnis nihil. Facilis, doloremque illum. Fugit optio laborum minus debitis natus illo perspiciatis corporis voluptatum rerum laboriosam.


Ordered List

  1. List item
  2. List item
  3. List item
  4. List item
  5. List item

Unordered List

  • List item
  • List item
  • List item
  • List item
  • List item

Notice

Note

This is a simple note.

Tip

This is a simple tip.

Info

This is a simple info.


Code and Syntax Highlighting

Inline code has back-ticks around it.

var s = "JavaScript syntax highlighting";
alert(s);
s = "Python syntax highlighting"
print s
No language indicated, so no syntax highlighting. 
But let's throw in a <b>tag</b>.

Blockquote

This is a blockquote example.


Inline HTML

You can also use raw HTML in your Markdown, and it’ll mostly work pretty well.

Definition list
Is something people use sometimes.
Markdown in HTML
Does *not* work **very** well. Use HTML tags.

Tables

Colons can be used to align columns.

TablesAreCool
col 3 isright-aligned$1600
col 2 iscentered$12
zebra stripesare neat$1

There must be at least 3 dashes separating each header cell. The outer pipes (|) are optional, and you don’t need to make the raw Markdown line up prettily. You can also use inline Markdown.

MarkdownLessPretty
Stillrendersnicely
123

Image

image


Youtube video

Terra-Tools

BPF Helper Functions for Maps

bpf_map_lookup_elem is a function in the Linux kernel’s BPF subsystem that is used to look up an element in a BPF map. BPF maps are key-value data structures that can be used by BPF programs running in the Linux kernel to store and retrieve data.

The bpf_map_lookup_elem function takes two arguments:

  1. map: A pointer to the BPF map to perform the lookup on.
  2. key: A pointer to the key used to look up the element in the map.

The function returns a pointer to the value associated with the given key in the BPF map if the key is found, or NULL if the key is not found.

The function signature for bpf_map_lookup_elem:

void *bpf_map_lookup_elem(void *map, const void *key);

In our program, bpf_map_lookup_elem() the helper function provided by the eBPF API that is used to look up an element in the BPF map. It takes two arguments:

rec = bpf_map_lookup_elem(&xdp_stats_map, &key);
  1. &xdp_stats_map: A pointer to the BPF map (struct bpf_map_def) that we want to perform the lookup on. In this case, it refers to the xdp_stats_map BPF map that was defined earlier in the code.
  2. &key: A pointer to the key that you want to look up in the map. The key is of type __u32 and its value is determined by the variable key in the code, which is set to XDP_PASS.

The bpf_map_lookup_elem() function returns a pointer to the value associated with the given key in the BPF map (&xdp_stats_map).

In other words, it allows you to retrieve the value stored in the BPF map corresponding to the key XDP_PASS and store it in the rec variable, which is of type struct datarec and represents the data record stored in the map.

Note that if the lookup fails (i.e., the key does not exist in the map), the function may return NULL, and it's important to perform a null pointer check, as shown in the code, to ensure the safety and correctness of the eBPF program.

	if (!rec)
		return XDP_ABORTED;

Code if (!rec) is checking if the value of the pointer rec is NULL or not.

If rec is NULL, it means that the lookup operation using bpf_map_lookup_elem() function failed, and the corresponding entry for the given key was not found in the BPF map xdp_stats_map.

The function returns XDP_ABORTED as the return value.

The program defines a BPF hash map named xdp_stats_map to store the statistics. The map is an array with a size equal to XDP_ACTION_MAX (max entries), where each entry represents a different XDP action.

struct bpf_map_def SEC("maps") xdp_stats_map = {
	.type        = BPF_MAP_TYPE_ARRAY,
	.key_size    = sizeof(__u32),
	.value_size  = sizeof(struct datarec),
	.max_entries = XDP_ACTION_MAX,
};

The XDP actions are enumerated in enum xdp_action,which is defined in include/uapi/linux/bpf.h and their values are XDP_ABORTED, XDP_DROP, XDP_PASS, XDP_TX, and XDP_REDIRECT. For each XDP action, a corresponding entry is created in the xdp_stats_map to store the number of packets that are associated with that action.

enum xdp_action {
	XDP_ABORTED = 0,
	XDP_DROP,
	XDP_PASS,
	XDP_TX,
	XDP_REDIRECT,
};


Safely modifying shared data with _sync_fetch_and_add
#ifndef lock_xadd
#define lock_xadd(ptr, val)	((void) __sync_fetch_and_add(ptr, val))
#endif

We define a macro lock_xadd that wraps the __sync_fetch_and_add function using the GCC built-in function __sync_fetch_and_add for performing an atomic fetch-and-add operation on a given memory location.

The macro takes two arguments: a pointer ptr to the target memory location, and a value val to be added to the current value of the memory location.

__sync_fetch_and_add is a built-in GCC (GNU Compiler Collection) function that provides an atomic operation for fetching the current value of a memory location, adding a value to it, and storing the result back into the same memory location in a single, uninterruptible step.

This function is typically used in multi-threaded or concurrent programming to safely update shared variables without race conditions or other synchronization issues.

The macro definition simply wraps the __sync_fetch_and_add function call with an additional (void) cast to suppress any potential warnings about unused results, as the function returns the previous value of the memory location before the addition, which might not be used in some cases.

lock_xadd
	lock_xadd(&rec->rx_packets, 1);

The lock_xadd() function is used to atomically increment the value of rec->rx_packets by 1.

This operation ensures that the increment is performed atomically, meaning that it is thread-safe and can be safely used in a multi-CPU environment where multiple threads may be accessing the same memory location simultaneously.

The purpose of this operation is to increment the packet count in the rx_packets field of the struct datarec data record, which is stored in the xdp_stats_map BPF map.

This allows the eBPF program to keep track of the number of packets that pass through the XDP hook

Once the packet count is updated, the eBPF program may return XDP_PASS to indicate that the packet should be allowed to continue processing by the kernel networking stack.

Repository Structure

xdp_prog_func

The main function in the program is xdp_prog_func, which is the actual XDP hook function.

  • This function is executed whenever a packet passes through the XDP hook.

  • The function first retrieves the data record associated with the XDP_PASS action from the xdp_stats_map using the bpf_map_lookup_elem() function.

  • If the lookup is successful, the function increments the packet counter associated with the XDP_PASS action using an atomic add operation (lock_xadd()).


common_kern_user.h

The common_kern_user.h header file is used by both the kernel-side BPF programs and userspace programs to share common structures and definitions.

struct datarec

In this specific case, the struct datarec is defined in common_kern_user.h as a data record that will be stored in a BPF map.

  • It has a single field rx_packets of type __u64, which is an unsigned 64-bit integer that represents the number of received packets.
XDP_ACTION_MAX

The XDP_ACTION_MAX is also defined in common_kern_user.h and represents the maximum number of actions that can be performed by an XDP (eXpress Data Path) program.

  • It is defined as XDP_REDIRECT + 1, where XDP_REDIRECT .
  • XDP_REDIRECT is a predefined constant that represents the maximum value of the enum xdp_action enumeration, which is an enum used to define different actions that can be taken by an XDP (eXpress Data Path) program in the Linux kernel.
enum xdp_action {
	XDP_ABORTED = 0,
	XDP_DROP,
	XDP_PASS,
	XDP_TX,
	XDP_REDIRECT,
};
  • In the provided code, the value of XDP_REDIRECT is used as the maximum number of entries in the xdp_stats_map BPF array map, which is used to store statistics for each possible XDP action.
  • By setting XDP_REDIRECT + 1 as the maximum number of entries, the xdp_stats_map array map will have enough space to store statistics for all possible XDP actions, including XDP_REDIRECT.
  • Therefore, the value of XDP_REDIRECT is used to determine the size of the array map and ensure that it has enough entries to accommodate all possible actions.

Progress

Progress - used to show progress. Progress can be determinate or indeterminate. Progress bar used to show ongoing process that takes time to finish. Usually used in:

  • Surveys
  • Linkedin Profiles
  • Feedback forms

Import

import Progress from '@intelops/intelops_ui/packages/react/components/Progress/src';

Create Progress bar

<Progress
    className="progress"
    variant="orange"
    progressPercentage="50"/>

Props

NameTypeDescription
idstringUnique to each element can be used to lookup an element getElementById( )
classNamestringTo add new or to override the applied styles
variantstringHas multiple colors - eight in total
progressPercentagestringProgress percentage

Variants

  1. fushia
  2. slate
  3. lime
  4. red
  5. orange
  6. cyan

Switch

Switch - used to adjust settings on/off. Switch can also be used as controls, as well as the state it’s in. Usually seen in:

  • Login page (Remember me)

Import

import Switch from '@intelops/intelops_ui/packages/react/components/Switch/src';

Create a Switch

  <SwitchButton
    className="switch"
    disabled ="false"
  >
  Name of the switch 
  </SwitchButton>

Props

NameTypeDescription
idstringUnique to each element can be used to lookup an element getElementById( )
classNamestringTo add new or to override the applied styles
childrennodeComponents content
disabledbooleanIf you want th switch to be diabled add true, else add false
onChangefunctionTo handle click changes - applied to the DOM element

Tab

Tab - can be used to create secondary navigation for your page. Tabs can also be used to navigate withing the same page taht is to render and display subsections for your website.

Import

import Tab from '@intelops/intelops_ui/packages/react/components/Tab/src';

Create a Tab

<Tab
    tabDetails={[
        {
            id: 1,
            label: "App",
            url: "#",
            icon: <ChartPieIcon className="w-6 h-6" color="red"/>, 
        },
        {
            id: 2,
            label: "Messages",
            url: "#",
            icon: <UserGroupIcon className="w-6 h-6" color="red"/>,
        },
        {
            id: 3,
            label: "Settings",
            url: "#",
            icon: <ServerIcon className="w-6 h-6" color="red"/>,
        },
    ]}
/>

Props

NameTypeDescription
idstringUnique to each element can be used to lookup an element getElementById( )
classNamestringTo add new or to override the applied styles
labelstringName of the tab element
urlstringUrl or the page that the user will be taken to on selecting the tab element
iconstringIcon for the tab element - may need a seperate className

Table

Tables - used to organize data in rows and columns and when you need to organize data. Tables also allow users to look up a specific information.

Import

import Table from '@intelops/intelops_ui/packages/react/components/Table/src';

Create a Table

<Table 
    title ="Intelops"
    className="table"
    columns={[
        {Header:"Name", accessor:"userName"},
        {Header:"Status", accessor:"status"},
        { Header: "Actions", accessor: "actions" },
        ]}
    tabledata={[
        {
            userName: "TJ",
            role: "Manager",
            actions: "Edit", 
        },
        {
            userName: "Ron",
            role: "Developer",
            actions: "Edit", 
        }
        ]}
/>

Props

NameTypeDescription
idstringUnique to each element can be used to lookup an element getElementById( )
classNamestringTo add new or to override the applied styles
titlestringTitle of the table
columnslist of array elementsNames of the columns and the accessor to add data into the respective columns
tabledatalist of array elementsData that needs to appear in the table - json format

Textarea

Textarea - allows users to enter sizeable amount of free-form text. Usually used in:

  • Forms
  • Tickets

Import

import Textarea from '@intelops/intelops_ui/packages/react/components/Textarea/src';

Create a Textarea

<Textarea 
    rows="4"
    placeholder="enter text"
    name="textarea name"/>

Props

NameTypeDescription
idstringUnique to each element can be used to lookup an element getElementById( )
classNamestringTo add new or to override the applied styles
rowsintheight of the box
placeholderstringtext that is visible before you enter data
Namestringtitle of the textarea
onChangefunctionTo handle change - when you enter data

Textfield

Textfield - how is it different from textarea? textfield is a single line, while textarea is usually multiple lines.

Import

import TextField from '@intelops/intelops_ui/packages/react/components/TextField/src';

Create a Textfield

<TextField 
    variant="small"
    placeholder="enter text"
    name="textarea name"
    required="true"/>

Props

NameTypeDescription
idstringUnique to each element can be used to lookup an element getElementById( )
classNamestringTo add new or to override the applied styles
variantstringThe size of your textfield and its padding
typestringValid HTML5 input value
placeholderstringtext that is visible before you enter data
namestringtitle of the textarea
onChangefunctionTo handle change - when you enter data
onClickfunctionTo handle Click
requiredbooleanIf true, then the field cannot be left empty
disabledbooleanIf true, then the component is disabled

Variant

  1. small
  2. default
  3. large

Tooltip

Tooltip - used for information on icons, buttons and so on. Tooltips are important in webdesign, they give us information just by hovering over a component.

Import

import Tooltip from '@intelops/intelops_ui/packages/react/components/Tooltip/src';

Create a Tooltip

<Tooltip
    variant="top"
    placeholder="enter text"> 
    Tooltip data 
</Tooltip>

Props

NameTypeDescription
idstringUnique to each element can be used to lookup an element getElementById( )
classNamestringTo add new or to override the applied styles
variantstringThe placement of the tooltip
typestringValid HTML5 input value

Variant

The placement of the tooltip, if you want to place the tooltip at the:

  1. top
  2. bottom
  3. left or
  4. right

Typography

Typography - used to choose your headings(titles or subtitles) on your webpage.

Import

import Typography from '@intelops/intelops_ui/packages/react/components/Typography/src';

Add Typography

<Typography
    variant="h5">
    Text to be displayed
</Typography>

Props

NameTypeDescription
idstringUnique to each element can be used to lookup an element getElementById( )
classNamestringTo add new or to override the applied styles
variantstringThe level of the heading
typestringValid HTML5 input value

Variants

The different levels of the heading. There are 6 levels from h1-h6 with h1 being the largest and h6 being the smallest.

h1. Level 1

h2. Level 2

h3. Level 3

h4. Level 4

h5. Level 5
h6. Level 6

Bridging the Gap: Managing Drift in Your Terraform Deployments with Driftctl

Terraform is an incredibly powerful tool for managing cloud infrastructure, but ensuring that your deployed resources match your intended state can be a challenge. This is where driftctl comes into play. driftctl is a command-line interface (CLI) tool designed to detect drift in your cloud infrastructure and bring resources back into compliance with your Terraform configurations. In this blog post, we’ll explore what driftctl is, why it’s important, and how you can integrate it into your Terraform workflows.

Understanding Drift in Terraform

Drift refers to the difference between the expected state of your infrastructure (as defined in your Terraform configuration files) and the actual state of your deployed resources in your cloud provider. This can occur due to manual changes, external automation, or other factors. Detecting and managing drift is crucial for maintaining a stable and secure infrastructure.

What is Driftctl?

driftctl is a powerful tool that helps you identify and manage drift in your Terraform deployments. It scans your cloud resources and compares their current state with the state defined in your Terraform state file. This enables you to quickly identify any discrepancies and take corrective action.

Key Features

1. Drift Detection

driftctl provides a comprehensive scan of your cloud infrastructure, highlighting any resources that have drifted from their intended state. This allows you to address issues before they lead to potential problems or security vulnerabilities.


title: “Driftctl” date: 2023-11-16 draft: false description: “The tool compares the actual state of your resources in the cloud provider with the state described in your Terraform state file. This detailed comparison helps you pinpoint specific resources that require attention.” weight: 5

2. State Comparison

The tool compares the actual state of your resources in the cloud provider with the state described in your Terraform state file. This detailed comparison helps you pinpoint specific resources that require attention.

3. Reporting and Alerts

driftctl offers reporting capabilities that provide a clear overview of detected drift. It can also generate alerts, enabling you to take timely action to rectify any discrepancies.

4. Integration with CI/CD

You can seamlessly integrate driftctl into your CI/CD pipelines. This allows you to perform drift detection as part of your deployment process, ensuring that your infrastructure remains in compliance with your Terraform configurations.

5. Multi-Cloud Support

driftctl supports multiple cloud providers, including AWS, Azure, Google Cloud Platform, and more. This makes it a versatile tool for managing drift in a variety of environments.

Getting Started with Driftctl

Installation

To get started with driftctl, visit the official GitHub repository at https://github.com/snyk/driftctl for installation instructions.

Running Driftctl

Once installed, running driftctl is as simple as executing:

driftctl scan

This command will initiate a scan of your cloud resources and generate a detailed report on detected drift.

You can observe the output as follows: alt text

Conclusion

Managing drift is a critical aspect of maintaining a stable and secure cloud infrastructure. driftctl provides an invaluable toolset for identifying and addressing discrepancies between your Terraform configurations and deployed resources. By integrating driftctl into your workflow, you can ensure that your infrastructure remains in compliance with your intended state.

Start using driftctl today and take control of your Terraform deployments!


Note: Always ensure you have the latest version of driftctl and refer to the official documentation for the most up-to-date information and best practices.

Learning Center

Looking for Cloud-Native Implementation?

Finding the right talent is pain. More so, keeping up with concepts, culture, technology and tools. We all have been there. Our AI-based automated solutions helps eliminate these issues, making your teams lives easy.

Contact Us